

Question: You are interested in investigating how class size determines test scores. To do so, you collect data from 50 students. The result of your regression
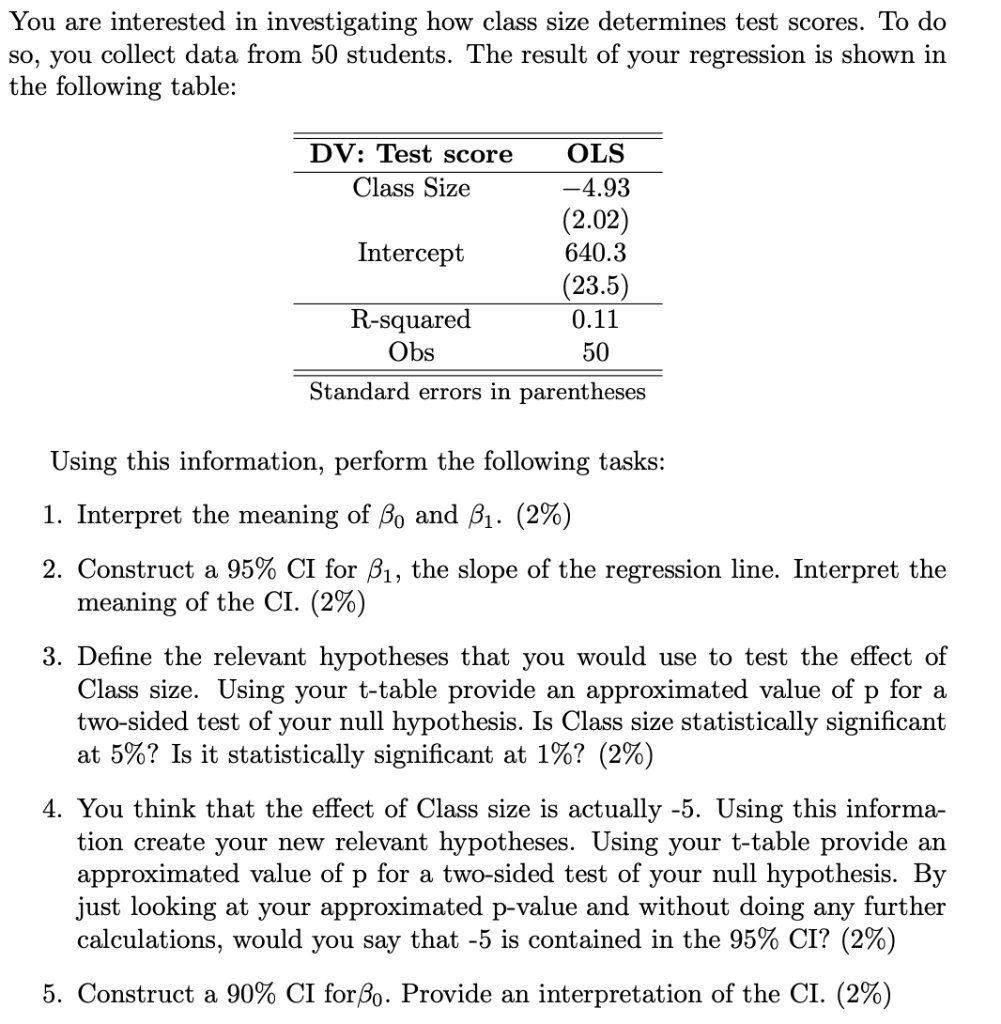
You are interested in investigating how class size determines test scores. To do so, you collect data from 50 students. The result of your regression is shown in the following table: DV: Test score OLS Class Size -4.93 (2.02) Intercept 640.3 (23.5) R-squared 0.11 Obs 50 Standard errors in parentheses Using this information, perform the following tasks: 1. Interpret the meaning of Bo and B1. (2%) 2. Construct a 95% CI for B1, the slope of the regression line. Interpret the meaning of the CI. (2%) 3. Define the relevant hypotheses that you would use to test the effect of Class size. Using your t-table provide an approximated value of p for a two-sided test of your null hypothesis. Is Class size statistically significant at 5%? Is it statistically significant at 1%? (2%) 4. You think that the effect of Class size is actually -5. Using this informa- tion create your new relevant hypotheses. Using your t-table provide an approximated value of p for a two-sided test of your null hypothesis. By just looking at your approximated p-value and without doing any further calculations, would you say that -5 is contained in the 95% CI? (2%) 5. Construct a 90% CI foro. Provide an interpretation of the CI. (2%)
Step by Step Solution
There are 3 Steps involved in it

Get step-by-step solutions from verified subject matter experts