

You are mentoring an elementary student interested in STEM and the student is fascinated with bugs. You
Question:
You are mentoring an elementary student interested in STEM and the student is fascinated with bugs. You heard that people used the number of cricket chirps as an easy way to gauge temperature, historically. Now your elementary student mentee wants to know more about how this works! You found some historical data online [1]. Write a MATLAB program to import the data from a .csv file (cricketData.csv), and then graph and analyze the imported data. You will also need to answer some follow-up questions (given in the Deliverables section).
1) Write a MATLAB script file that:
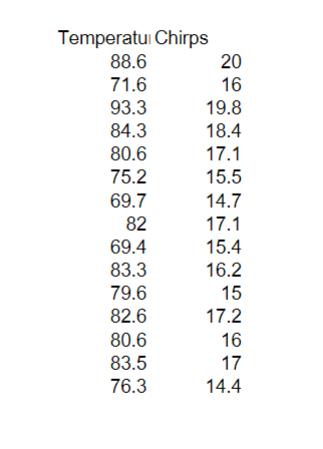
a. Reads the cricketData.csv file. Note that the first column contains the air temperature (T in degrees Fahrenheit), and the second column contains the rate of chirping (R in chirp per second). According to the website housing the data [1], this data is for striped ground cricket.
b. Uses the plot command to create a scatter plot (on rectilinear graph paper) of the rate of chirping (y-axis) as a function of air temperature (x-axis), using ‘o’ to indicate each data point. Your plot should have axis labels that include quantity, symbol, and units; and your plot should have a meaningful title.
c. Use polyfit to find equation constants for the best-fit line.
d. Adds a best-fit line describing the predicted relationship between temperature and rate of chirping to your plot, using the equation coefficients determined by polyfill.
e. Displays the equation with units and descriptive variable names in the command window using fprintf. Numbers should be formatted so that there are two values after the decimal (notice the period in the following hint: %.2f ).
2) Create a sample run showing output to the command window and to a figure window. Copy this output using screen capture(s) and/or a copy of the figure. Text within the screen capture(s) and/or the figure must be legible.
3) Answer the four follow-up questions given in the Deliverables section.
1. What do the results suggest about the relationship between temperature and rate of chirping?
2. What might explain the results?
3. How good is the fit of the model (the equation of the best-fit line) to the data?
4. Your mentee wants to do a similar experiment. What advice would you give your mentee to help them be successful in collecting the necessary data?
cricketData.csv:
Expert Answer:
Certainly I can help you with that Heres a MATLAB script that reads the cricketDatacsv file creates a scatter plot of the rate of chirping as a function of air temperature fits a bestfit line to the d... View the full answer


Public Relations Strategies and Tactics
ISBN: 978-0134003689
11th edition
Authors: Dennis L. Wilcox, Glen T. Cameron
