

Question: You are performing an experiment in the lab for finding the effect of change in criteria on other criteria. For example the following table records
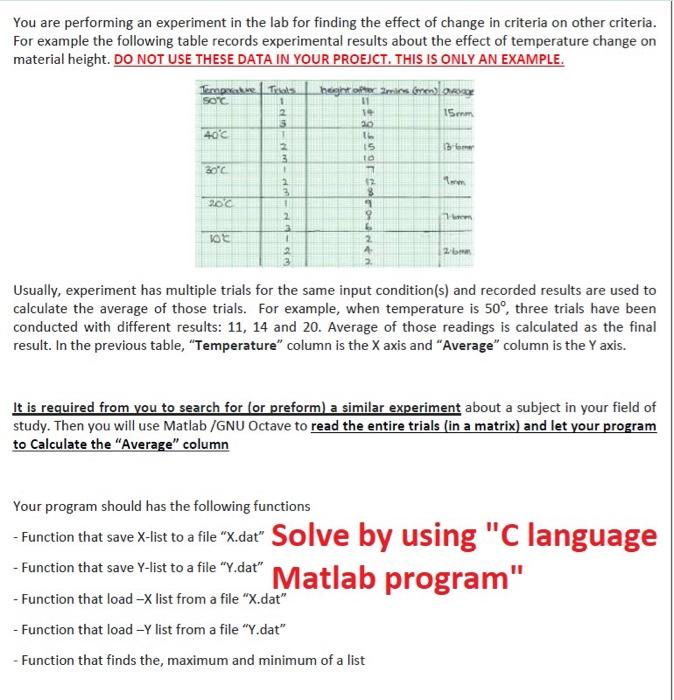

You are performing an experiment in the lab for finding the effect of change in criteria on other criteria. For example the following table records experimental results about the effect of temperature change on material height. DO NOT USE THESE DATA IN YOUR PROEJCT. THIS IS ONLY AN EXAMPLE. Tempratre / Treats height of mis ). ORIE 15.com sonc 1 11 19 20 40C 3 1 2 3 15 Blow 2010 7 2 2 3 2006 co 2 hrem VE 2 A 2 Usually, experiment has multiple trials for the same input condition(s) and recorded results are used to calculate the average of those trials. For example, when temperature is 50, three trials have been conducted with different results: 11, 14 and 20. Average of those readings is calculated as the final result. In the previous table, "Temperature" column is the X axis and "Average" column is the Y axis. It is required from you to search for (or preform) a similar experiment about a subject in your field of study. Then you will use Matlab/GNU Octave to read the entire trials (in a matrix) and let your program to Calculate the "Average" column Your program should has the following functions - Function that save X-list to a file "X.dat" Solve by using "C language - Function that save Y-is to a file ".da" Matlab program" - Function that load -> list from a file "X.dat" - Function that load - list from a file "Y.dat" - Function that finds the, maximum and minimum of a list - Function that calculate the average, the standard deviation and the variance of a list. - Plot X-Y data and the Generated Polynomial from Curve Fitting. Then the program should do the following: 1- Find the average of trials. For the above table it should looks like the following: X = [ 50 40 30 2010]; Trials = (11 16 792; 14 15 128 4; 20 10 8 6 2]; Y = mean (Trials); 2- Find the maximum, minimum, average, the standard deviation and the variance of Y list. 3- Generate the best-fit polynomial for your results. 4. Find the critical point(s) of your results. (You already learned in Calculus 1 course that critical points are obtained from the first derivative of the polynomial ..... Search in the internet how to do that in Matlab/ GNU Octave). 5- Plot the data and best-fit polynomial that pass (almost) through all readings. 6- Save the X and Y lists. Solve by using "C language" Matlab Program The final report of the project should include: Objective of the experiment Images about the experiment. Experiment hypothesis Experiment table of readings (like the one above) Plot / Plots of results and the best fit polynomial plot. Best fit polynomial formula Table that contains Mean, Standard Deviation, Variance, Min, Max and Maximum Growth Rate. Your Code. You are performing an experiment in the lab for finding the effect of change in criteria on other criteria. For example the following table records experimental results about the effect of temperature change on material height. DO NOT USE THESE DATA IN YOUR PROEJCT. THIS IS ONLY AN EXAMPLE. Tempratre / Treats height of mis ). ORIE 15.com sonc 1 11 19 20 40C 3 1 2 3 15 Blow 2010 7 2 2 3 2006 co 2 hrem VE 2 A 2 Usually, experiment has multiple trials for the same input condition(s) and recorded results are used to calculate the average of those trials. For example, when temperature is 50, three trials have been conducted with different results: 11, 14 and 20. Average of those readings is calculated as the final result. In the previous table, "Temperature" column is the X axis and "Average" column is the Y axis. It is required from you to search for (or preform) a similar experiment about a subject in your field of study. Then you will use Matlab/GNU Octave to read the entire trials (in a matrix) and let your program to Calculate the "Average" column Your program should has the following functions - Function that save X-list to a file "X.dat" Solve by using "C language - Function that save Y-is to a file ".da" Matlab program" - Function that load -> list from a file "X.dat" - Function that load - list from a file "Y.dat" - Function that finds the, maximum and minimum of a list - Function that calculate the average, the standard deviation and the variance of a list. - Plot X-Y data and the Generated Polynomial from Curve Fitting. Then the program should do the following: 1- Find the average of trials. For the above table it should looks like the following: X = [ 50 40 30 2010]; Trials = (11 16 792; 14 15 128 4; 20 10 8 6 2]; Y = mean (Trials); 2- Find the maximum, minimum, average, the standard deviation and the variance of Y list. 3- Generate the best-fit polynomial for your results. 4. Find the critical point(s) of your results. (You already learned in Calculus 1 course that critical points are obtained from the first derivative of the polynomial ..... Search in the internet how to do that in Matlab/ GNU Octave). 5- Plot the data and best-fit polynomial that pass (almost) through all readings. 6- Save the X and Y lists. Solve by using "C language" Matlab Program The final report of the project should include: Objective of the experiment Images about the experiment. Experiment hypothesis Experiment table of readings (like the one above) Plot / Plots of results and the best fit polynomial plot. Best fit polynomial formula Table that contains Mean, Standard Deviation, Variance, Min, Max and Maximum Growth Rate. Your Code
Step by Step Solution
There are 3 Steps involved in it

Get step-by-step solutions from verified subject matter experts