

Question: You are presented with the linear model tted to the following data The colors indicate different professions. Based off this visualization which model would you
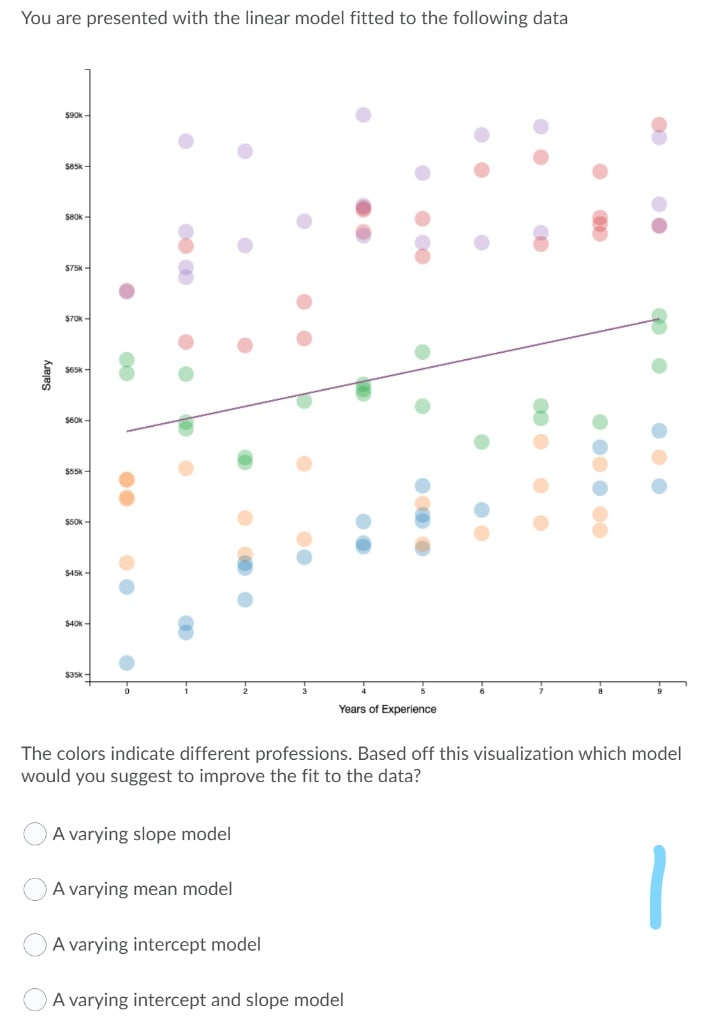
You are presented with the linear model tted to the following data The colors indicate different professions. Based off this visualization which model would you suggest to improve the fit to the data? O A varying slope model 0 A varying mean model 0 A varving intercept model {3 A varying intercept and slope model
Step by Step Solution
There are 3 Steps involved in it
1 Expert Approved Answer
Step: 1 Unlock

Question Has Been Solved by an Expert!
Get step-by-step solutions from verified subject matter experts
Step: 2 Unlock
Step: 3 Unlock