

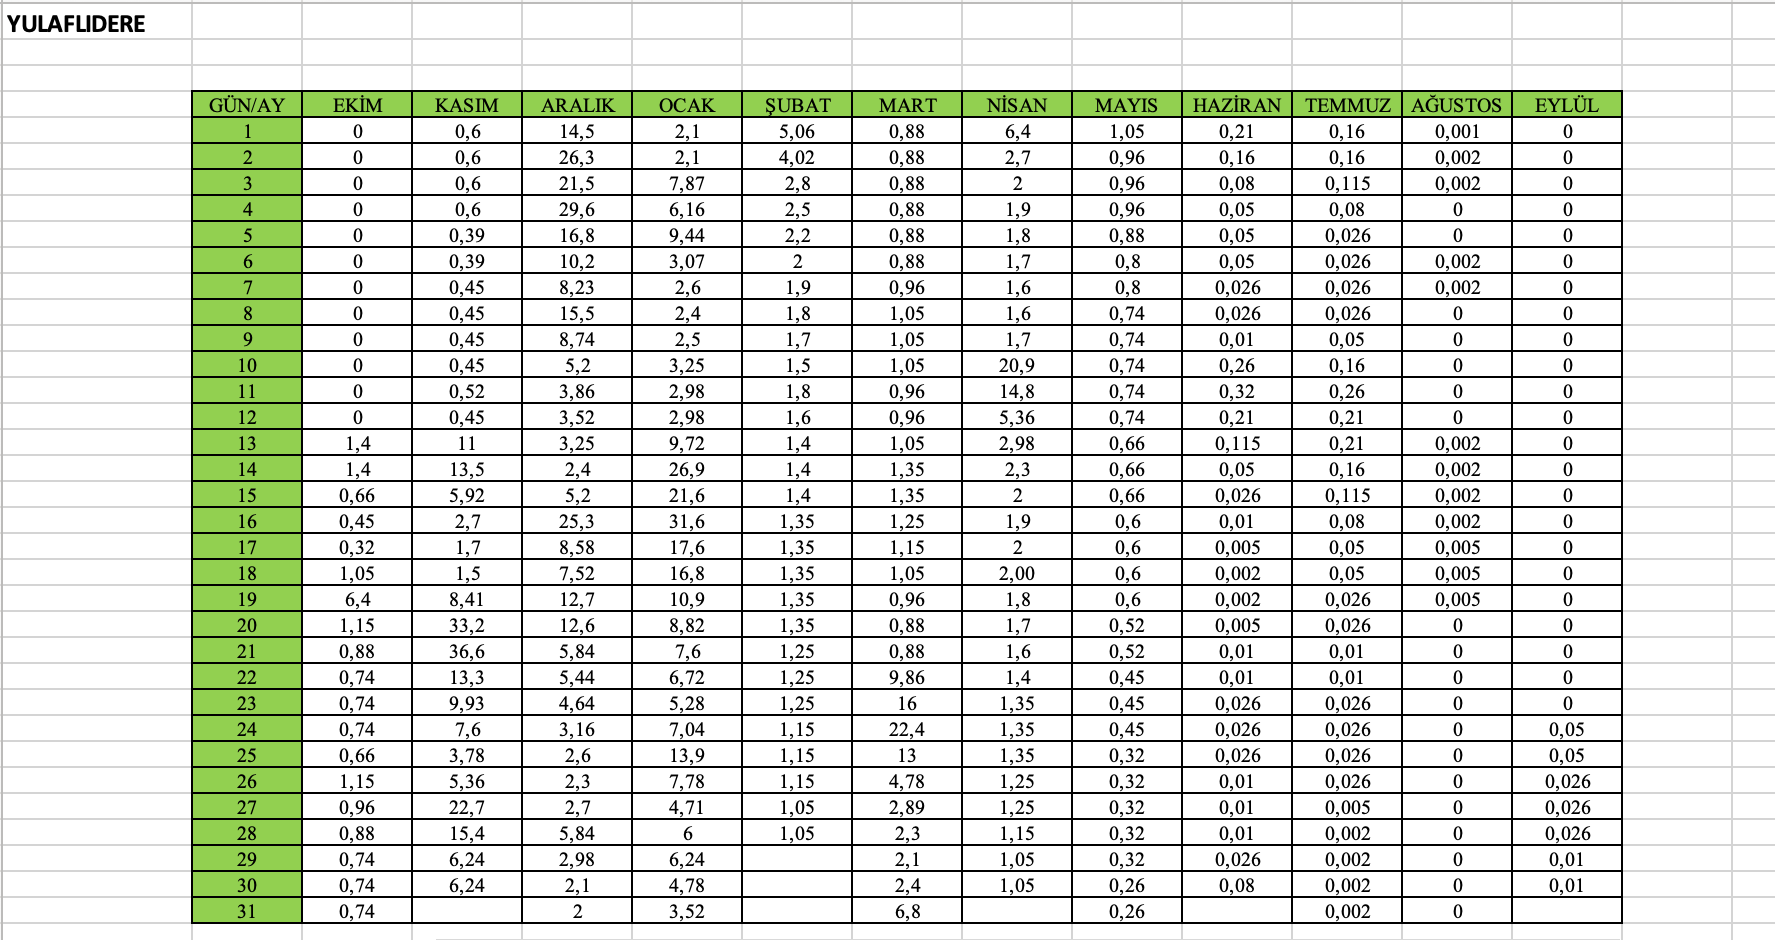
Question: You are provided the stream flow data from DSI for the water year of 1 9 9 5 ( October 1 9 9 4 -
You are provided the stream flow data from DSI for the water year of October
September Daily stream discharges are reported in ms Find your station from the
list in the next page and obtain the data from the document shared in the Google drive
filename: DSIpdf
You are asked to the perform the following tasks on your dataset and write up a report.
Provide a map that shows the station you can use Google Earth
Plot daily values of the discharges for each month. you can use four panels for each
season of the year and plot each threemonth on each panel
For each month, calculate the total discharge m using both trapezoidal and
Simpsons rules. Make a table of the that shows results for each month and for each
numerical integration method. Also include the total annual discharges for each
method and include as the bottom line of your table.
Plot the monthly discharge data for each method.
Fit a spline curve to the monthly discharge data Task and show on the same plot
in Task
Your report should include total of map, table, and graphs.
Step by Step Solution
There are 3 Steps involved in it
1 Expert Approved Answer
Step: 1 Unlock

Question Has Been Solved by an Expert!
Get step-by-step solutions from verified subject matter experts
Step: 2 Unlock
Step: 3 Unlock