

Question: You are provided two sets of time series data. Data Set #1 includes demand data from Sept-Feb and Data Set #2 includes demand data from
You are provided two sets of time series data. Data Set #1 includes demand data from Sept-Feb and Data Set #2 includes demand data from Mar-August.
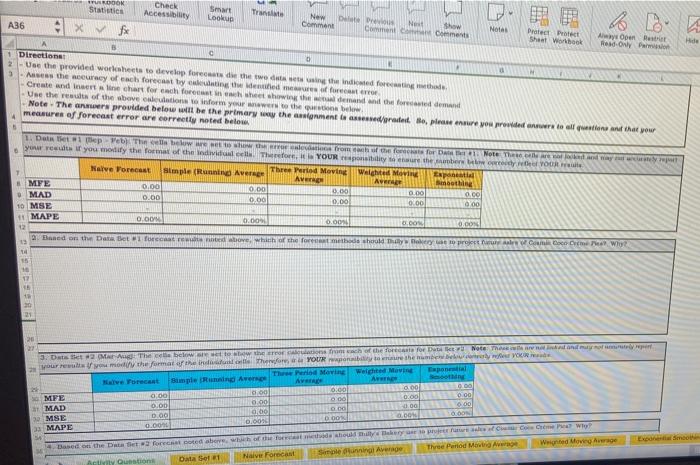
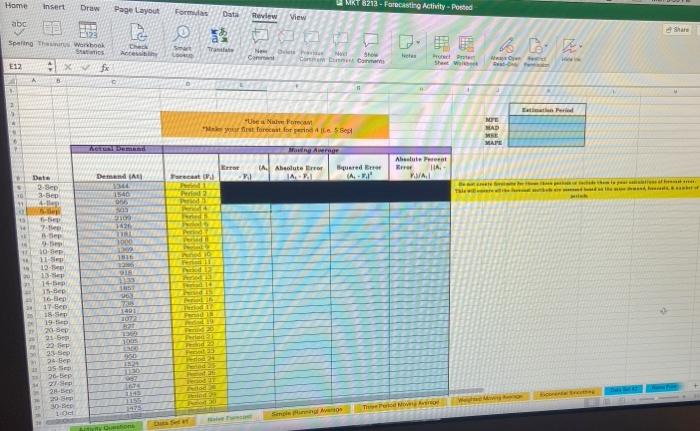
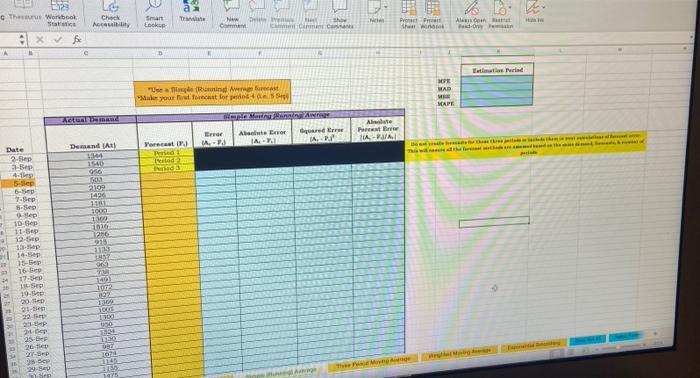
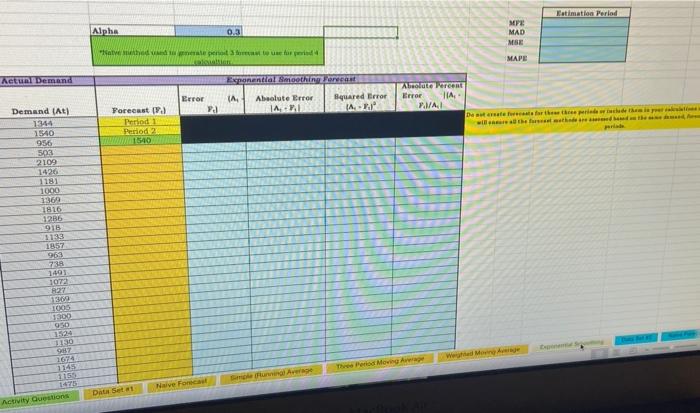
Generate the five different forecasts and the corresponding measures of forecast error for the two different data sets. Note: The provided Excel file includes separate worksheets for you to use when creating each of the different time series forecasts.
For each forecast, create a line graph showing actual demand and the calculated forecast for the estimation period. (Note: do this for each individual forecast and include the graph on the same worksheet as the forecast.)
Use the cells provided to calculate the identified error measures for each of the forecasts. Note: these cells are linked to the Activity Question sheet to help show all of your answers in one location. However, it is your responsibility to ensure the information presented on the Activity Question sheet is accurate.
Answer all the questions included in Worksheet 1 of the Excel file. It is labeled Activity Questions.


TDOOR Statistics Check Accessibility Seart Looku Translate A36 4Xfx New Com Net 2 Com Show Notas Protect Shaal Worthook Always Open Rest Rond Paris 1 Directions 2 Use the provided worksheets to develop for the twenting the Indicated for the M 3 As the secrecy of each forecasting the effect Create and are chart for each foreich she show the demand and the force demand Use the results of the above collations to inform you to the bow Note. The provided below will be the primary the mentale planure you provided to all one and that you measures of forecast error are correctly noted below 5 1. Dat 1 p - Yet Thells below are the front for Note The you read you modify the format of the individuale Thor, YOUR po to the TOER Narve Forecast Simple Running Average Threr Pried Moving Weight MVI 7 Expo AVEN A Smoothing 5 MFE 0.00 0.00 0.00 0.001 0.00 MAD 0.00 0.00 0.00! 0.00 0.00 10 MSE MAPE 0. 0.00 0.00 0.COM OOON 12 2. Enned on the Dar et forewinted ovel which of the forest method a projecte come Why 12 1 15 12 19 30 21 . 3. 2 MATA The below them the forecast for Dute Note that are not our rewut mod the format of the theor YOUR to be Berly ve Forecast simple d Avenge The Moving Welighted Movie Ave AN MFE 0.00 0.00 0.00 MAD 0.00 0.00 0.00 3 MSE 0.00 0.00 0.00 000000 MAPE 0.00 0.00 DONO.000 . 4. Based on the Dew Porch Doted above, who he should huller Cowy Act Duestions Data Soft Nave Forecast Spurning Average The Period Movie Writed Movie Age Home Insert Draw MKT 8213 - Forecasting Activity - Posted Page Layout Formidas Data Review View abc Share Spaling The Worshoek Ch Antown San LORES De Tra Ne Con De No Show Cat Com Hus E12 Shaw X 5 fx A EP UN Foreca first forecast for de 5 MTE MAD WSE MAPE Met Demi WRANDE Ahsolute Error IA Demand All Abaut we TIA MAI ured A. act Date 2.Sep 3-Sep 4. www 1540 On - 7. Step 210 TAM 100 10-S 11 SE 19-5 13 14- 1TB Pod 16 en 18 Sep 19 20 20 21 Sep 22 21. Sep 2.Sep 355 26-tep - Sep 2. 20.5 30- 10 15 17 The Poo San On DO E123 The Wortbook Sea X Check AL ma okup New C C Post She A Pedom e Eurid MPE MAD Und forecast Make your forecast for po Ketua PRANE Aler ured IA IA Error A-7. Alte Part TIARA Demand Forecast 1.1 1540 966 100 2102 142 111 940 2000 Date 2-Sep Sep . Seder 6-Sep 7-Sep 5-Sep 10 Sep 11-tep 12-54 13. ep 14-es 11 is lep 17.5 10- 21 11 16 15 1403 TUT 20. - 2 p NO 15 11 25-5 26 en 27-S ber 2 Sep 26 WERE MAD ht your o 55 WARE Alta Demand Eero . Alter IA A. HAI Demand (A) Forecast Pod 2011 Date 2-Sep 3-Sep 4-Sep 15.00 500 2100 1426 100 & Se 7. 1 9.5 10- 11-Se 12 135 4-5 12 95 15 Se 17 Sep 15- 19.5 40 102 20- 100 21.se > CO 24 25.5 20 BE 25 SI ME NAD WIE About Er Alter JA Demand At Yra MAI Date 2. Sep VE se 1620 OO WE 1 CE 7.5 -Sep 9-3 10 Sep 11-04 12- 15- 14- 15 sep 16- 17- 75 19.5 20p 215 23 23- 26 25 20 Ser 2. VEL 14 To ENT 100 1200 Katimation Period Alpha 0.3 MFE MAD MSE atehere for MAPE Actual Demand Error Pa Exponendal Nothing Lorecast IA Absolute Error Squared Error 14 A. Auto Percent Error TIA P.IAI De starter the wheel will the then the Porecast (1) Period Pod2 WW1540 Demand (at) 1344 1540 956 503 2109 1426 1181 1000 11169 1816 1286 915 1133 1857 963 738 1401 1072 22 1300 1300 050 12 97 1674 1145 115 The Period Moving Average Naive Foreca Di Sett Activity Questions TDOOR Statistics Check Accessibility Seart Looku Translate A36 4Xfx New Com Net 2 Com Show Notas Protect Shaal Worthook Always Open Rest Rond Paris 1 Directions 2 Use the provided worksheets to develop for the twenting the Indicated for the M 3 As the secrecy of each forecasting the effect Create and are chart for each foreich she show the demand and the force demand Use the results of the above collations to inform you to the bow Note. The provided below will be the primary the mentale planure you provided to all one and that you measures of forecast error are correctly noted below 5 1. Dat 1 p - Yet Thells below are the front for Note The you read you modify the format of the individuale Thor, YOUR po to the TOER Narve Forecast Simple Running Average Threr Pried Moving Weight MVI 7 Expo AVEN A Smoothing 5 MFE 0.00 0.00 0.00 0.001 0.00 MAD 0.00 0.00 0.00! 0.00 0.00 10 MSE MAPE 0. 0.00 0.00 0.COM OOON 12 2. Enned on the Dar et forewinted ovel which of the forest method a projecte come Why 12 1 15 12 19 30 21 . 3. 2 MATA The below them the forecast for Dute Note that are not our rewut mod the format of the theor YOUR to be Berly ve Forecast simple d Avenge The Moving Welighted Movie Ave AN MFE 0.00 0.00 0.00 MAD 0.00 0.00 0.00 3 MSE 0.00 0.00 0.00 000000 MAPE 0.00 0.00 DONO.000 . 4. Based on the Dew Porch Doted above, who he should huller Cowy Act Duestions Data Soft Nave Forecast Spurning Average The Period Movie Writed Movie Age Home Insert Draw MKT 8213 - Forecasting Activity - Posted Page Layout Formidas Data Review View abc Share Spaling The Worshoek Ch Antown San LORES De Tra Ne Con De No Show Cat Com Hus E12 Shaw X 5 fx A EP UN Foreca first forecast for de 5 MTE MAD WSE MAPE Met Demi WRANDE Ahsolute Error IA Demand All Abaut we TIA MAI ured A. act Date 2.Sep 3-Sep 4. www 1540 On - 7. Step 210 TAM 100 10-S 11 SE 19-5 13 14- 1TB Pod 16 en 18 Sep 19 20 20 21 Sep 22 21. Sep 2.Sep 355 26-tep - Sep 2. 20.5 30- 10 15 17 The Poo San On DO E123 The Wortbook Sea X Check AL ma okup New C C Post She A Pedom e Eurid MPE MAD Und forecast Make your forecast for po Ketua PRANE Aler ured IA IA Error A-7. Alte Part TIARA Demand Forecast 1.1 1540 966 100 2102 142 111 940 2000 Date 2-Sep Sep . Seder 6-Sep 7-Sep 5-Sep 10 Sep 11-tep 12-54 13. ep 14-es 11 is lep 17.5 10- 21 11 16 15 1403 TUT 20. - 2 p NO 15 11 25-5 26 en 27-S ber 2 Sep 26 WERE MAD ht your o 55 WARE Alta Demand Eero . Alter IA A. HAI Demand (A) Forecast Pod 2011 Date 2-Sep 3-Sep 4-Sep 15.00 500 2100 1426 100 & Se 7. 1 9.5 10- 11-Se 12 135 4-5 12 95 15 Se 17 Sep 15- 19.5 40 102 20- 100 21.se > CO 24 25.5 20 BE 25 SI ME NAD WIE About Er Alter JA Demand At Yra MAI Date 2. Sep VE se 1620 OO WE 1 CE 7.5 -Sep 9-3 10 Sep 11-04 12- 15- 14- 15 sep 16- 17- 75 19.5 20p 215 23 23- 26 25 20 Ser 2. VEL 14 To ENT 100 1200 Katimation Period Alpha 0.3 MFE MAD MSE atehere for MAPE Actual Demand Error Pa Exponendal Nothing Lorecast IA Absolute Error Squared Error 14 A. Auto Percent Error TIA P.IAI De starter the wheel will the then the Porecast (1) Period Pod2 WW1540 Demand (at) 1344 1540 956 503 2109 1426 1181 1000 11169 1816 1286 915 1133 1857 963 738 1401 1072 22 1300 1300 050 12 97 1674 1145 115 The Period Moving Average Naive Foreca Di Sett Activity Questions
Step by Step Solution
There are 3 Steps involved in it

Get step-by-step solutions from verified subject matter experts