

Question: You are provided with the following sample observations relating to historical rate of returns and their corresponding probabilities for individual assets, Brad and Ford:
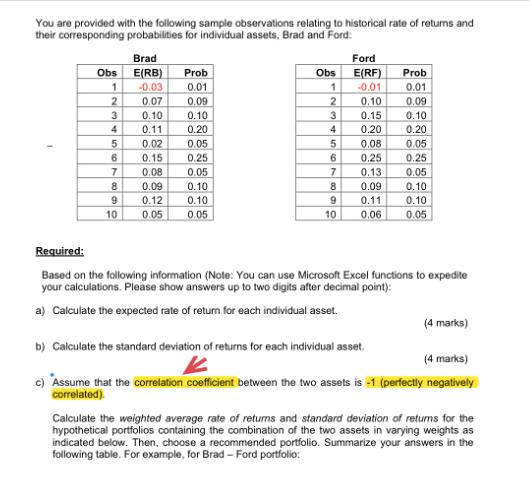
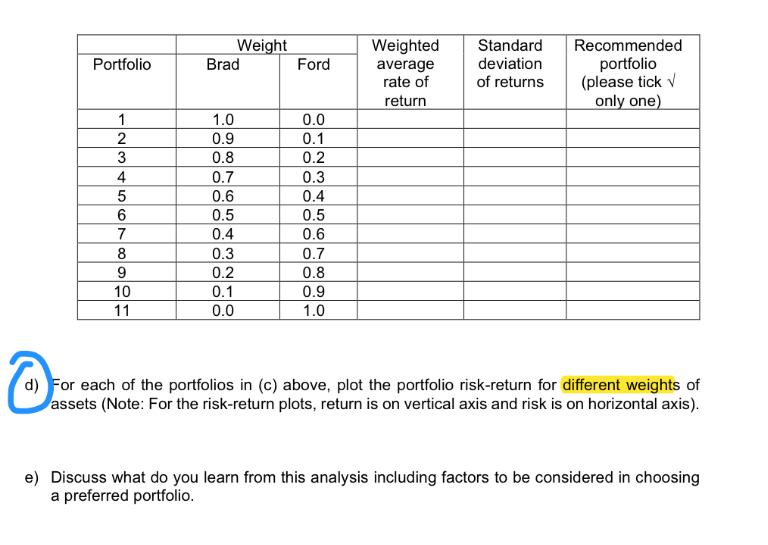
You are provided with the following sample observations relating to historical rate of returns and their corresponding probabilities for individual assets, Brad and Ford: Obs 1 2 3 4 5 67890 10 Brad E(RB) -0.03 0.07 0.10 0.11 0.02 0.15 Prob 0.01 0.09 0.10 0.20 0.05 0.25 0.08 0.05 0.09 0.10 0.12 0.10 0.05 0.05 Obs 1 2 3 4 5 6 7 8 9 10 Ford E(RF) -0.01 0.10 0.15 0.20 0.08 0.25 0.13 0.09 0.11 0.06 Prob 0.01 0.09 0.10 0.20 0.05 0.25 0.05 0.10 0.10 0.05 Required: Based on the following information (Note: You can use Microsoft Excel functions to expedite your calculations. Please show answers up to two digits after decimal point): a) Calculate the expected rate of return for each individual asset. b) Calculate the standard deviation of returns for each individual asset. (4 marks) (4 marks) c) Assume that the correlation coefficient between the two assets is -1 (perfectly negatively correlated). Calculate the weighted average rate of returns and standard deviation of returns for the hypothetical portfolios containing the combination of the two assets in varying weights as indicated below. Then, choose a recommended portfolio. Summarize your answers in the following table. For example, for Brad - Ford portfolio: Portfolio 1 2 3 4 5 6 7 8 9 10 11 Brad 1.0 0.9 0.8 0.7 0.6 Weight 0.5 0.4 0.3 0.2 0.1 0.0 Ford 0.0 0.1 0.2 0.3 0.4 0.5 0.6 0.7 0.8 0.9 1.0 Weighted average rate of return Standard deviation of returns Recommended portfolio (please tick only one) O For each of the portfolios in (c) above, plot the portfolio risk-return for different weights of assets (Note: For the risk-return plots, return is on vertical axis and risk is on horizontal axis). e) Discuss what do you learn from this analysis including factors to be considered in choosing a preferred portfolio.
Step by Step Solution
3.54 Rating (161 Votes )
There are 3 Steps involved in it
Lets start by calculating the expected rate of return and the standard deviation for each individual ... View full answer

Get step-by-step solutions from verified subject matter experts