

Question: you are required to analyse the returns from several groups of investment types. Assume that each observation represents the value of an investment after one
you are required to analyse the returns from several groups of investment types. Assume that each observation represents the value of an investment after one yearbased on an original investment of $1,000 and tell descriptive data analysis and tell descriptive data analysis .please also tell something about the data and also comment on the shape of the distributions of each group, key ,statistics, unusual observations, and anything, that is relevant. Also tell what the observation tells us about the data.
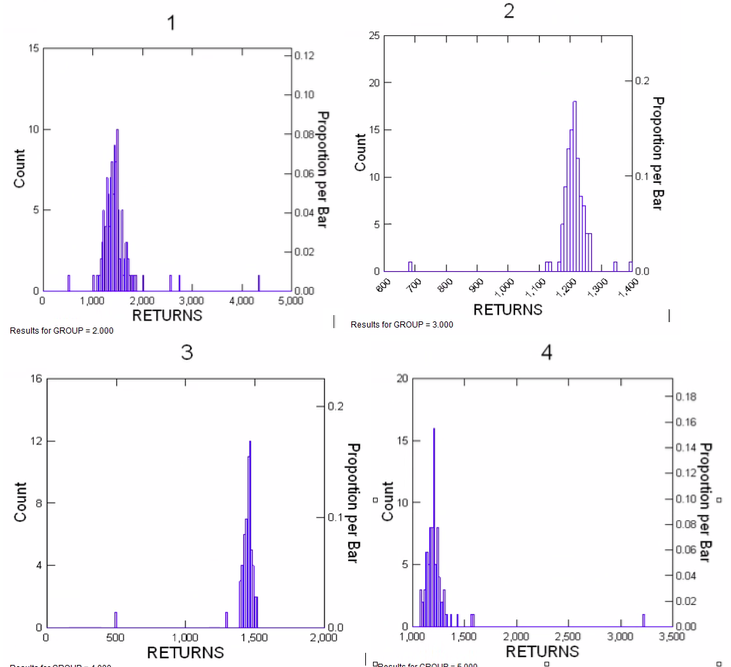
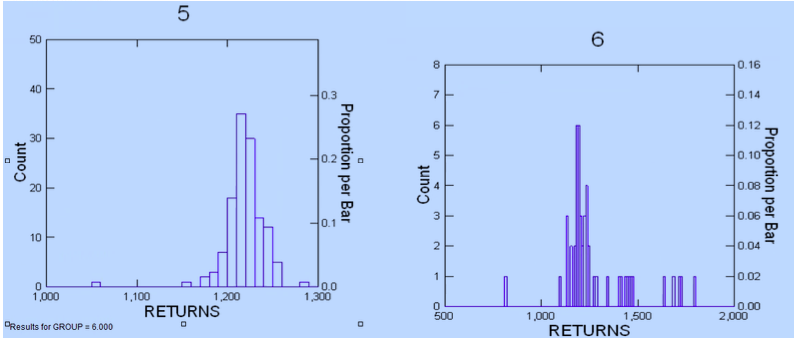
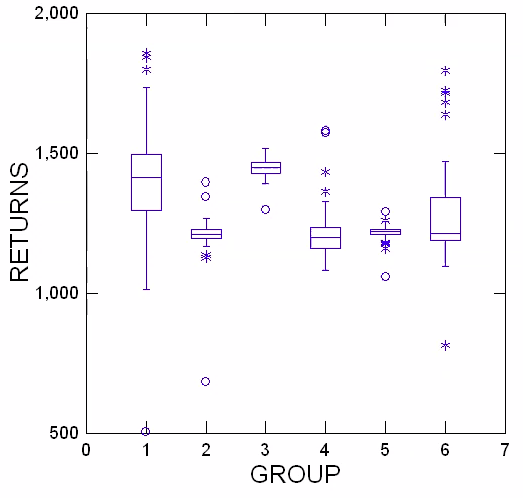
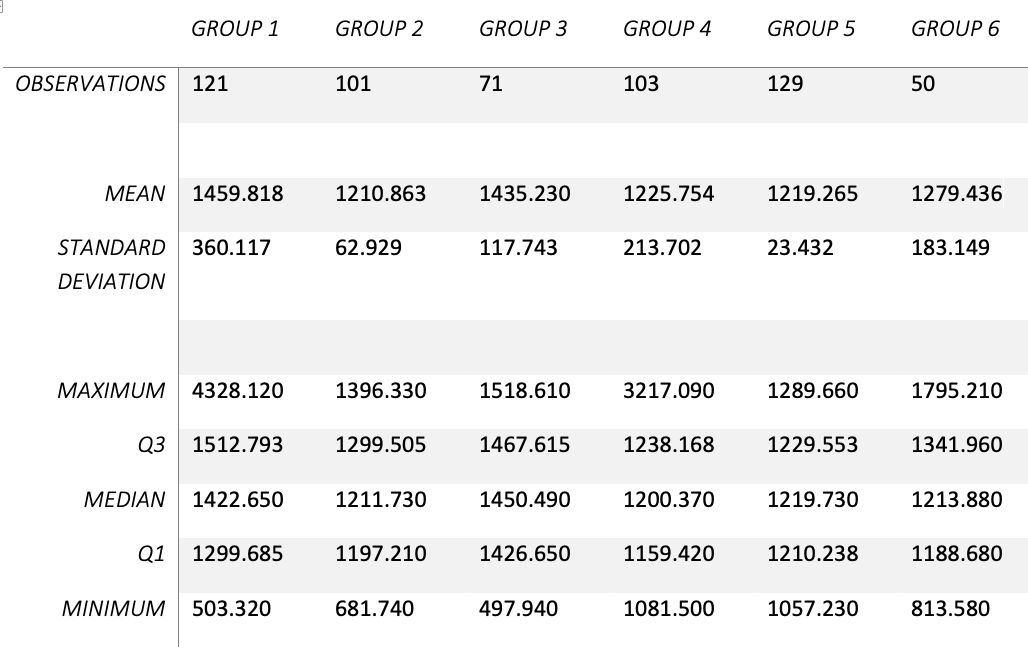
2 25 15 0.12 20 -0.10 -0.2 10 -0.08 15- Count -0.06 Count 10 - -0.1 5 -0.04 Proportion per Bar Proportion per Bar - 0.02 0.0 300 1.400 1,000 2,000 3,000 4,000 -0.00 5,000 A ACN 4. 200 RETURNS RETURNS Results for GROUP = 2.000 Results for GROUP = 3.000 3 4 16 20 -0.2 -0.18 -0.16 12 15 0.147 Count Proportion per Bar Count - 0.12 8 10 0.10 9 -0.1 0.08 4 -0.06 Proportion per Bar -0.04 -0.02 500 1,000 1,500 0.0 2,000 1,000 RETURNS 1,500 2,000 2,500 3,000 0.00 3,500 RETURNS5 50 6 8 0.16 40 0.3 7 6 Count 30 0.2 5 0.10 20 Proportion per Bar 0.14 0.12 Count 0.08 10.1 3 0.06 10 2 0.04 Proportion per Bar n 0.02 1,000 1,100 1,200 1,300 RETURNS 0 500 1,000 1,500 0.00 Results for GROUP = 6.000 2.000 RETURNS\fGROUP 1 GROUP 2 GROUP 3 GROUP 4 GROUP 5 GROUP 6 OBSERVATIONS 121 101 71 103 129 50 MEAN 1459.818 1210.863 1435.230 1225.754 1219.265 1279.436 STANDARD 360.117 62.929 117.743 213.702 23.432 183.149 DEVIATION MAXIMUM 4328.120 1396.330 1518.610 3217.090 1289.660 1795.210 Q3 1512.793 1299.505 1467.615 1238.168 1229.553 1341.960 MEDIAN 1422.650 1211.730 1450.490 1200.370 1219.730 1213.880 Q1 1299.685 1197.210 1426.650 1159.420 1210.238 1188.680 MINIMUM 503.320 681.740 497.940 1081.500 1057.230 813.580
Step by Step Solution
There are 3 Steps involved in it

Get step-by-step solutions from verified subject matter experts