

Question: You are studying the gene expression in different human cell types. One of your collaborators uses PCA to reduce the dimensionality of the data and
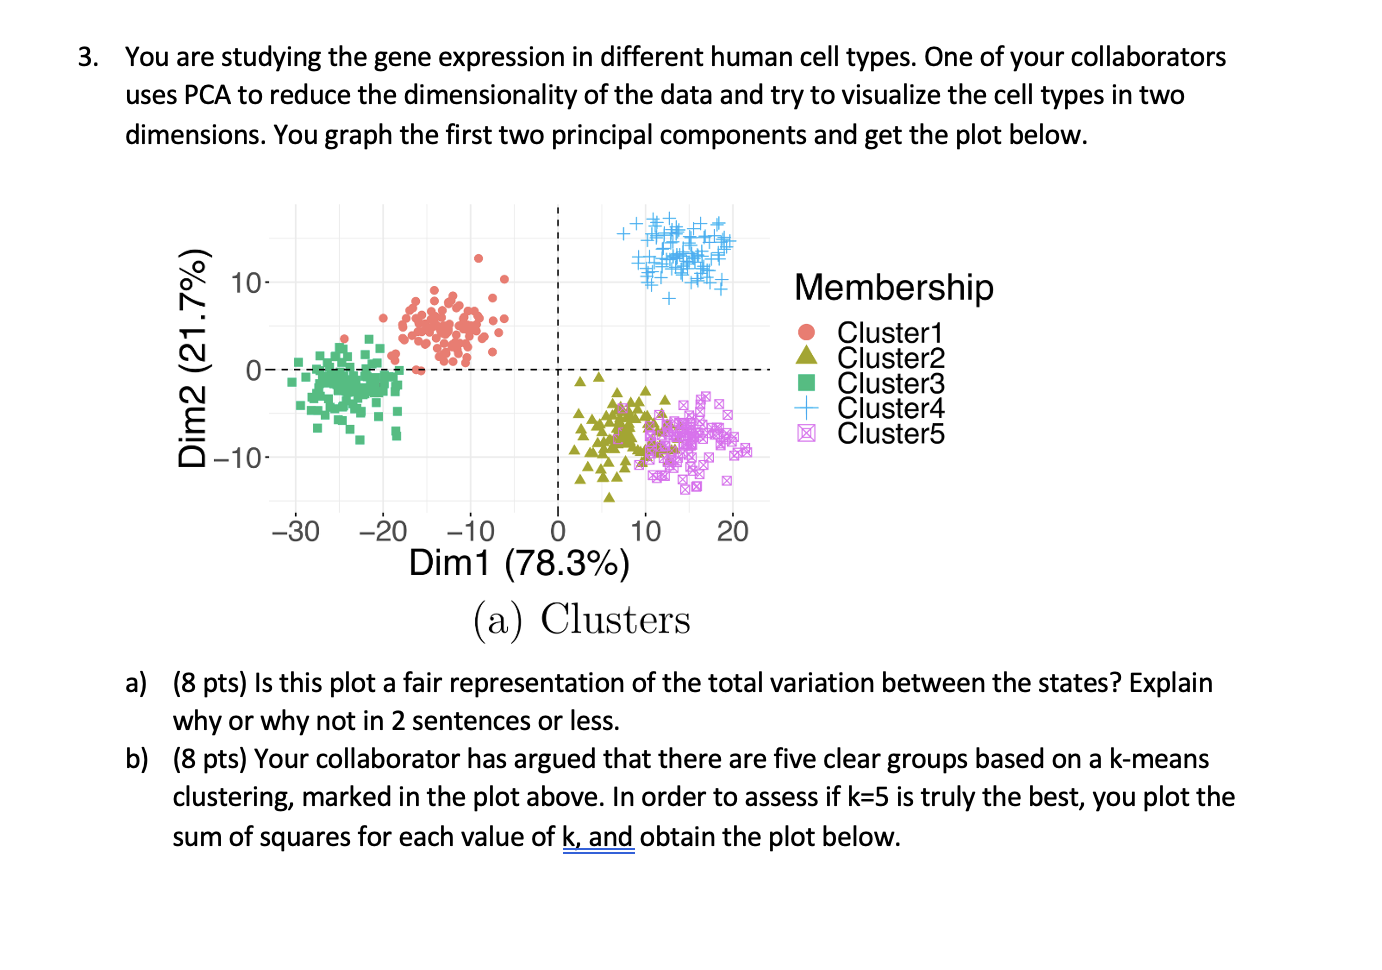
You are studying the gene expression in different human cell types. One of your collaborators uses PCA to reduce the dimensionality of the data and try to visualize the cell types in two dimensions. You graph the first two principal components and get the plot below.
a pts Is this plot a fair representation of the total variation between the states? Explain why or why not in sentences or less.
b pts Your collaborator has argued that there are five clear groups based on a kmeans clustering, marked in the plot above. In order to assess if is truly the best, you plot the sum of squares for each value of and obtain the plot below. Based on the above plot, what value of is best for clustering the data? You are studying the gene expression in different human cell types. One of your collaborators uses PCA to reduce the dimensionality of the data and try to visualize the cell types in two dimensions. You graph the first two principal components and get the plot below
Step by Step Solution
There are 3 Steps involved in it
1 Expert Approved Answer
Step: 1 Unlock

Question Has Been Solved by an Expert!
Get step-by-step solutions from verified subject matter experts
Step: 2 Unlock
Step: 3 Unlock