

Question: You are tasked with analyzing data to create center-line, UCL, and LCL for c-charts, p-charts, X ? charts, and R charts. You must also plot
You are tasked with analyzing data to create center-line, UCL, and LCL for c-charts, p-charts, X ? charts, and R charts. You must also plot the data points and interpret patterns present in each chart to decide whether any assignable causes of variation are visible, and whether each process is in statistical control.
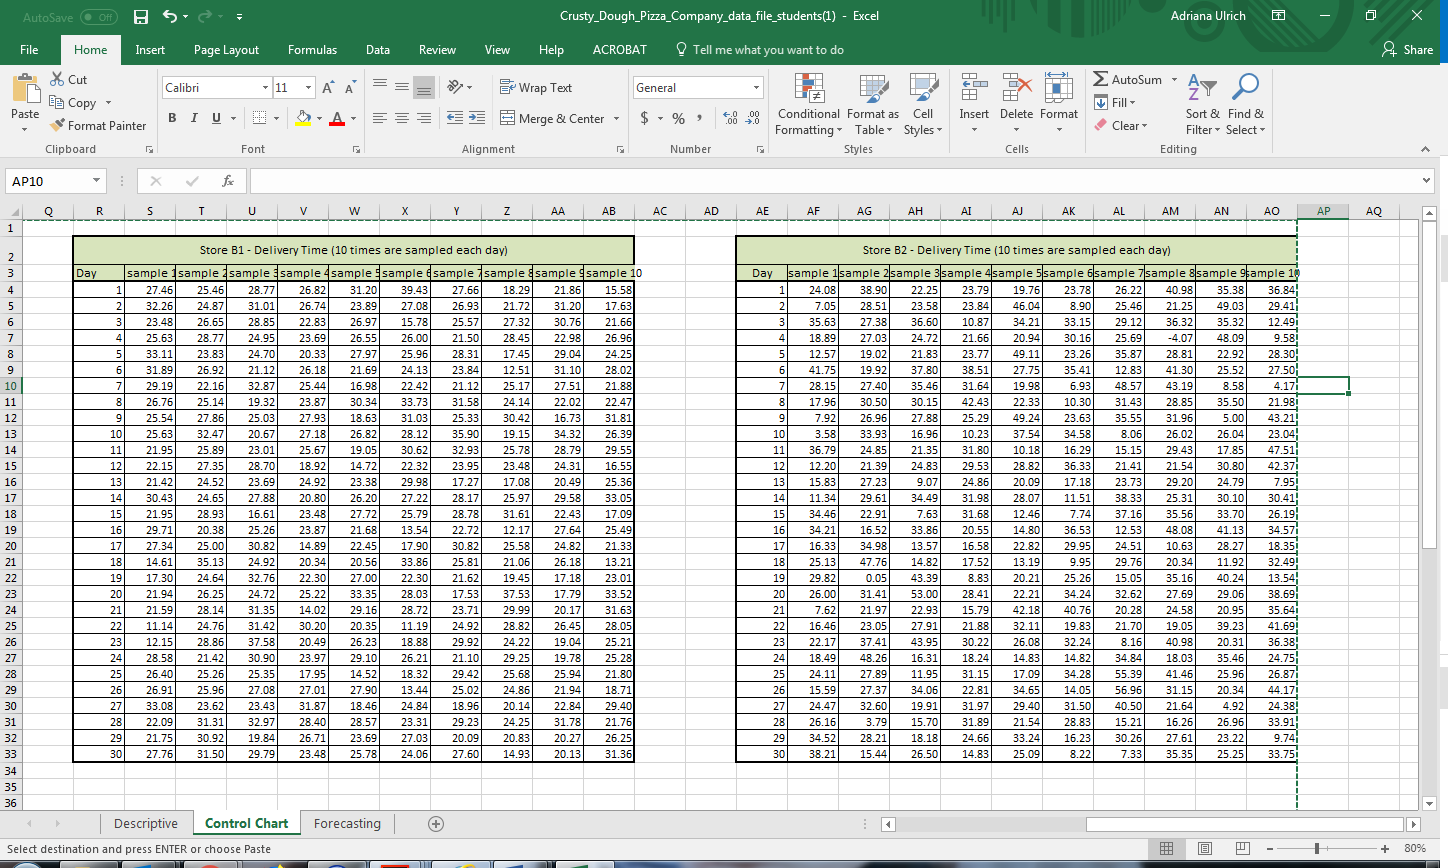
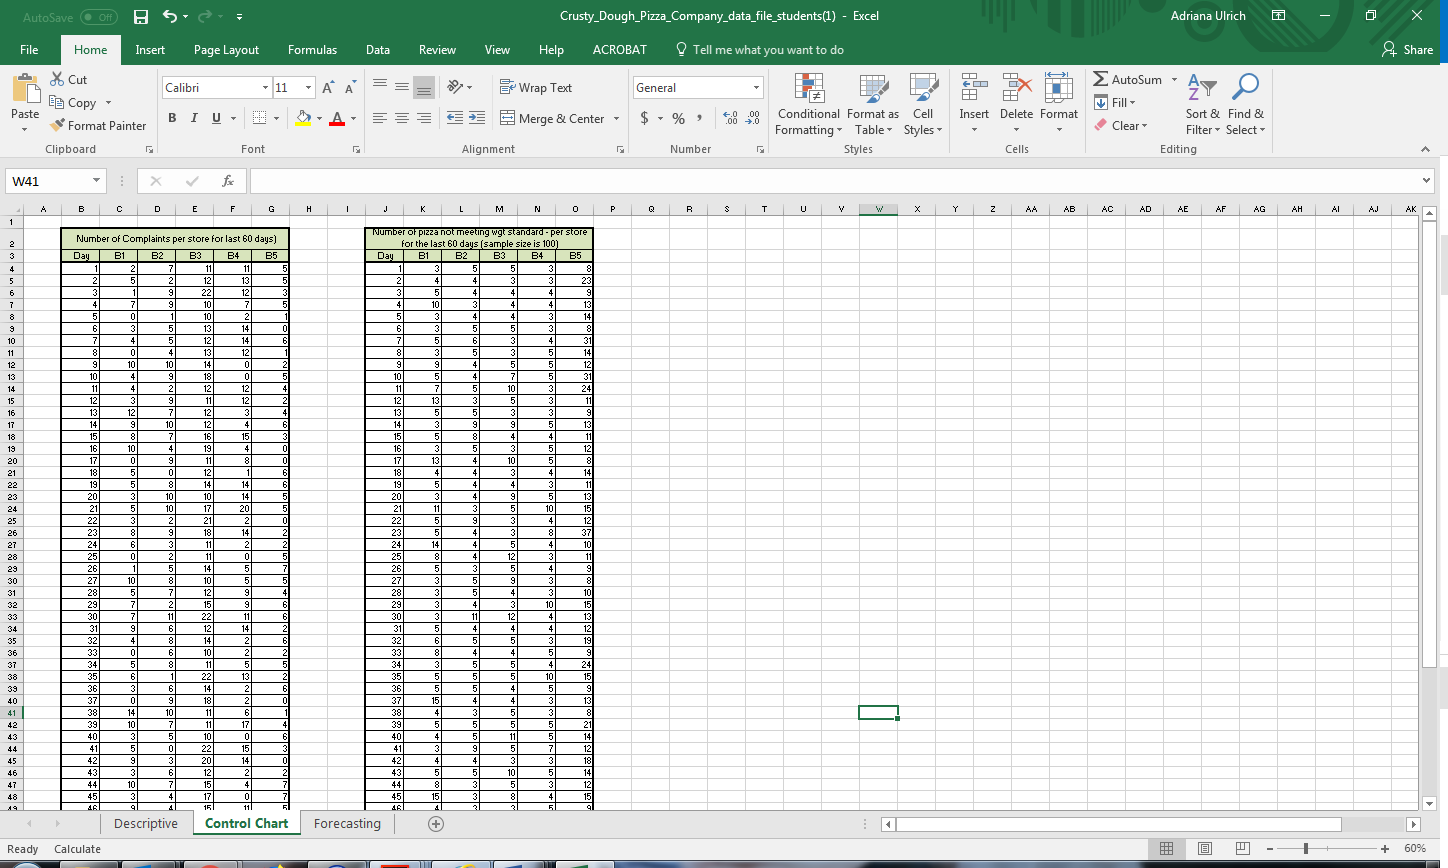
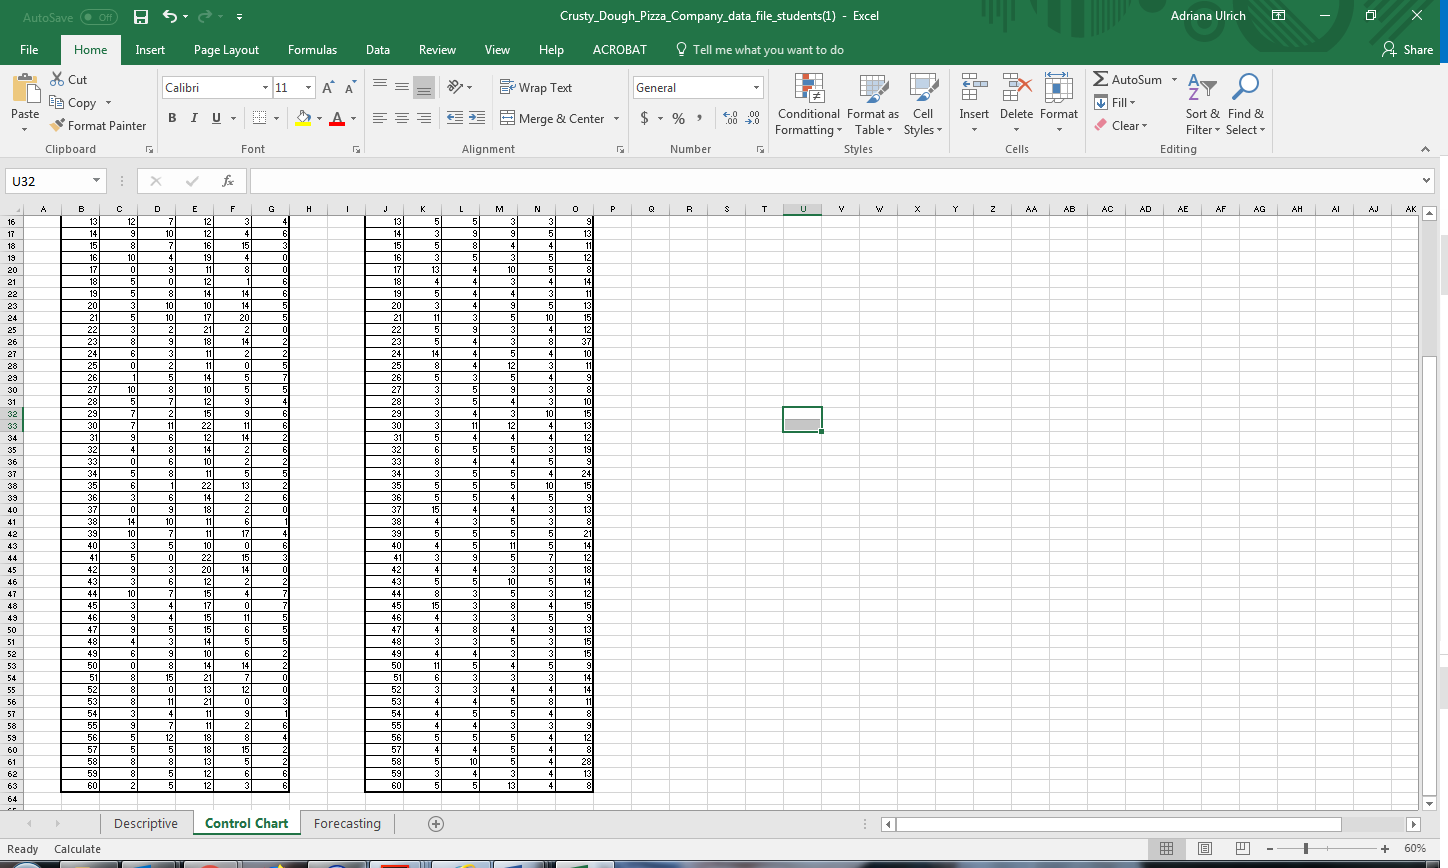
IZrusq-j P Adrlana Ulrlch E Help AER '- chm . V . up u .l D (allbn ~11 v A A W/v ngBpTem General v t I 53 \"\" \"fix 3\" Emmsm ' 12'? p Past EECOW' n [In Codt lFo t Cell I rt Dale: qut Elmv Sartlel 7 7 7 7 e .2 vpmmawamter B I Q ' ' aha" E Me'gecenm . $ . % , \"D '\" Forg;ttllcr'lngav T'aTslfssg-Iv "5'2 v 2 Ta 'Clear' Fllrervseleq. Cllpbuard r. Font r. Allgnment I: Number I: styles Cells Edltlng A AP10 ' - fr V _||_||_|_ V l 2 films In- Delivery'rime [latimas are sampled each day] Store B2- DeliveryTime (1a limes are sampled each day: 3 sample sample sample sample- sample.sample samplesample samplem 4 57 L 77 a 9 1|) 1 12 13 14 11 15 |sllmlzelm llglw Ed 11mm E Di twill?! E a til ' Descriptl've Control Chart Forecasting ' (-9 E 4 > Select destlnatlon and press ENTER or choose Paste El 14 - 4'77 + 80% mm _-i' - a.' _d __- ' AdrIarIa UIrIcII E J. Lu u N - D ago" (aIIbn . 11 v A' A' * IP/v @5475me GeneraI v J \"\" \"fix 3H Emmsum "2'? p Ea Cow v ' " EIFIIIv Paste 'FormatPaInter B I Q , . 8),, A' : : : '5 95 ._ MergetCenter . $ . % , eg .f' CondltlcmaI Formatas CeII Insert Delete Format 'ClearV Sartt Fmdt V FormamngV TabIeV StylV V V V ' FIIterVSelectV Clebuard I: Font I: Alignment I: Number I: sters CelIs Emtmg A W41 ' . r v .AIEICIDIEIFIGIHIII.IIKILIMINIDIPIDIHISITIUIVWXIYIZIAAIABIACIADIAEIAFIAEIAHIAIIAJI I _ I 2 NumberaFDampIaImsperslnlefollaszsdags] \"m :3tgurgzzgxp'::2me 3 Da EII I32 I33 I34 I55 n5 BI 32 33 I34 T I 2 7 II II 5 I 3 5 5 CI 3 5 2 5 2 I2 I5 5 2 4 4 3 5 25 5 3 I 5 22 I2 5 3 5 4 4 4 5 i 4 7 5 In 7 5 4 In 3 4 4 I5 5 5 n I In 2 I 5 3 4 4 5 I4 3 E 3 5 I3 14 [I E 3 5 5 CI B In 7 4 5 I2 I4 5 7 5 5 3 4 3I II 5 n 4 I5 I2 I 5 3 5 3 5 I4 I2 3 In In I4 n 2 3 3 4 5 5 I2 I3 In 4 3 I5 5 5 ID 5 4 7 5 3I II II 4 2 I2 I2 4 II 7 5 In 3 24 Is I2 3 3 II I2 2 I2 I3 3 5 5 II I5 I3 I2 7 I2 5 4 I3 5 5 3 5 5 I7 I4 5 In I2 4 5 I4 3 3 5 5 I5 I5 I5 5 7 I5 I5 5 I5 5 5 4 4 II IS I5 In 4 I5 4 n I5 3 5 3 5 I2 25 I7 5 3 II 5 5 I7 I3 4 In 5 5 21 IE 5 [I I2 I 5 IE 4 4 3 4 W 22 I3 5 5 I4 I4 5 I3 5 4 4 5 II 23 25 3 In In I4 5 25 3 4 3 5 I5 2: 2I 5 In I7 2n 5 2I II 3 5 In I5 25 22 3 2 2I 2 5 22 5 3 3 4 I2 26 23 E 3 IE 14 Z 23 5 4 3 B 37 27 24 5 5 II 2 2 24 I4 4 5 4 In 25 25 n 2 II n 5 25 5 4 I2 5 II as 25 I 5 I4 5 7 25 5 3 5 4 5 35 27 In 5 I5 5 5 27 3 5 3 5 5 31 28 E 7 I2 3 4 28 3 5 4 CI IEI 52 23 7 2 I5 3 5 23 3 4 3 I5 I5 53 35 7 II 22 II s 55 3 II I2 4 I5 34 3I 5 5 I2 I4 2 5I 5 4 4 4 I2 55 32 4 5 I4 2 5 52 5 5 5 5 I3 36 33 El 5 IEI Z Z 33 E 4 4 5 3 s7 34 5 5 II 5 5 54 3 5 5 4 24 55 35 5 I 22 I5 2 55 5 5 5 In I5 33 35 3 5 I4 2 5 35 5 5 4 5 5 45 37 n 3 I5 2 u 57 I5 4 4 5 I5 11 SE H IEI II S I 38 4 3 5 CI 3 42 33 In 7 II I7 4 53 5 5 5 5 2I 43 4D 3 5 In 5 s 45 4 5 II 5 I4 u 4I 5 n 22 I5 5 4I 3 3 5 7 I2 45 42 3 5 25 I4 5 42 4 4 3 5 I5 16 43 3 5 I2 2 Z 43 5 5 ID 5 W 47 44 In 7 I5 4 7 44 5 3 5 5 I2 45 45 3 4 I7 5 7 45 I5 3 5 4 I5 .4 I: q l IR II R '9 I R Q V DescriptI've Control Chart Forecasting ' (-9 4 | > Ready CalcuIate El 33 _4|_.7+ 60% mm _-i' -a-I _- __- ' \f
Step by Step Solution
There are 3 Steps involved in it

Get step-by-step solutions from verified subject matter experts