

Question: You are using the sample below to test for a relationship between category and population. Population Population Category #1 #2 A 18 60 B 46
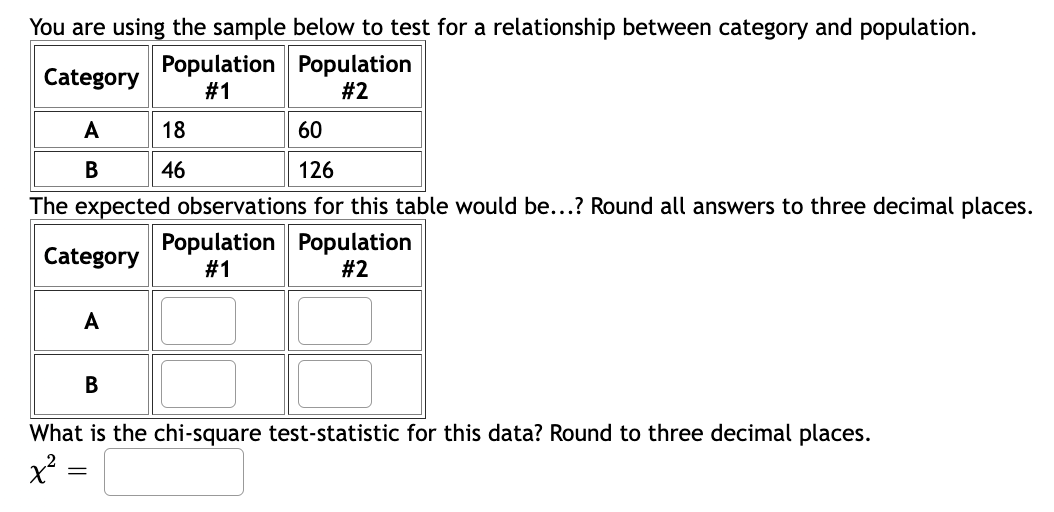
You are using the sample below to test for a relationship between category and population. Population Population Category #1 #2 A 18 60 B 46 126 ns for this table would be...? Round all answers to three decimal places. Population Population #1 #2 What is the chi-square test-statistic for this data? Round to three decimal places. X2
Step by Step Solution
There are 3 Steps involved in it
1 Expert Approved Answer
Step: 1 Unlock

Question Has Been Solved by an Expert!
Get step-by-step solutions from verified subject matter experts
Step: 2 Unlock
Step: 3 Unlock