

Question: You are working as a data analyst for a retail company BuyOnlineZ. Last week your manager approached you and advised you to deliver a report
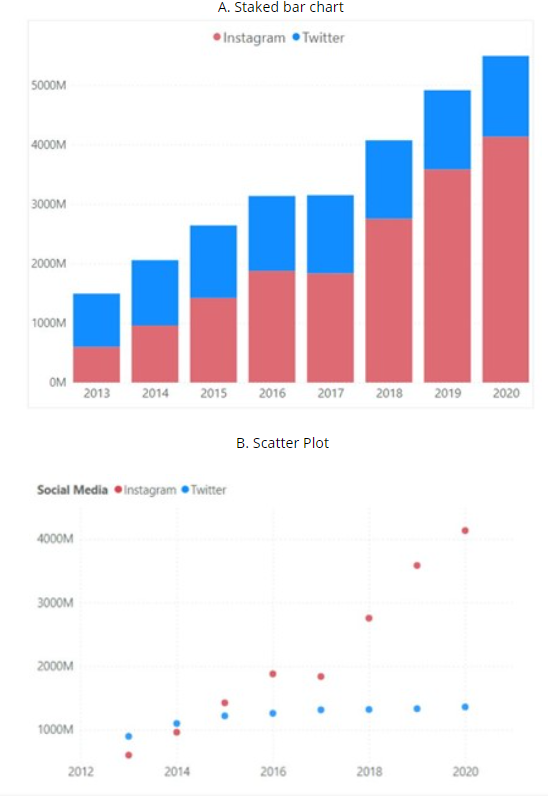
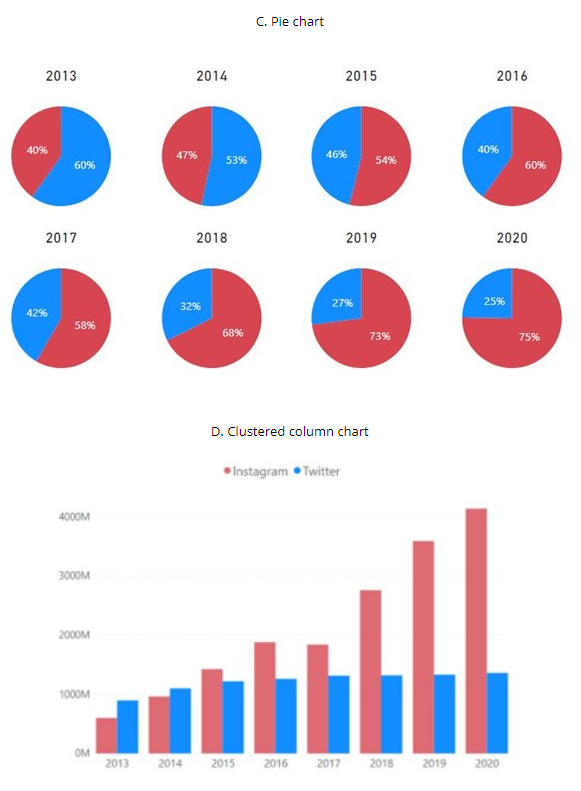
You are working as a data analyst for a retail company BuyOnlineZ. Last week your manager approached you and advised you to deliver a report on the social media key performance indicators. You identified Social Media Reach as a key performance indicator metric, which refers to the number of users who have come across a particular content on a social media platform. Which of the following visualization is ideal to display the overall Social Media Reach over time?
Step by Step Solution
There are 3 Steps involved in it
1 Expert Approved Answer
Step: 1 Unlock

Question Has Been Solved by an Expert!
Get step-by-step solutions from verified subject matter experts
Step: 2 Unlock
Step: 3 Unlock