

Question: You can do it in an excel sheet and upload it or send it if its easier Use the price data from the table in
You can do it in an excel sheet and upload it or send it if its easier
Use the price data from the table in the image 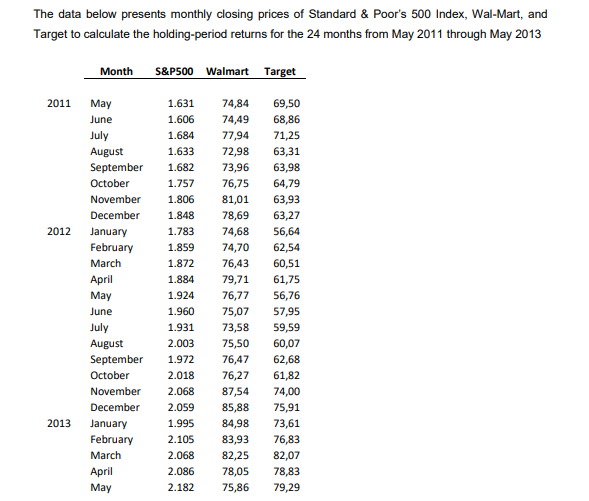
for the Standard & Poors 500 Index, Wal-Mart, and Target to calculate the holding-period returns for the 24 months from May 2011 through May 2013. Calculate the average monthly holding-period returns and the standard deviation of these returns for the S&P Index, Wal-Mart, and Target. Please compare the results obtained for these three series.
b. Plot (1) the holding-period returns for Wal-Mart against the Standard & Poors 500 Index, and (2) the Target holding-period returns against the Standard & Poors 500 Index. From your graphs, describe the nature of the relationship between stock returns for Wal-Mart and the returns for the S&P 500 Index. Make the same comparison for Target
c. Assume that you have decided to invest one-half of your money in Wal-Mart and the remainder in Target. Calculate the monthly holding-period returns for your two-stock portfolio. (The monthly return for the portfolio is the average of the two stocks monthly returns.) Plot the returns of your two-stock portfolio against the Standard & Poors 500 Index as you did for the individual stocks in part b. How does this graph compare to the graphs for the individual stocks? Explain the difference.
d. Make a comparison of the average returns and the standard deviations for all the individual assets and the portfolio that was created. What conclusions can be reached by your comparison in the context of the risk and return (hint: think about the benefits of the diversification)?
e. According to Standard & Poors, the betas for Wal-Mart and Target are 0.48 and 0.85, respectively. Compare the meaning of these betas relative to the standard deviations calculated above. Answer the question in the context of the systematic and unsystematic risk.
f. The Treasury bill rate at the end of May 2013 was 4%. Given the betas for Wal-Mart and Target and using the above data for the S&P Index as a measure for the market portfolio expected return, estimate an appropriate required rate of return, using the CAPM model and given the level of systematic risk for each stock. You need to convert the monthly average S&P500 return into annual terms simply by multiplying by 12. What do you conclude?
The data below presents monthly closing prices of Standard & Poor's 500 Index, Wal-Mart, and Target to calculate the holding-period returns for the 24 months from May 2011 through May 2013 Month S&P500 Walmart Target 2011 May 1.631 69,50 June 1.606 68,86 July 1.684 74,84 74,49 77,94 72,98 73,96 1.633 August September October 1.682 1.757 November 1.806 December 1.848 2012 1.783 January February March 1.859 1.872 71,25 63,31 63,98 64,79 63,93 63,27 56,64 62,54 60,51 61,75 56,76 57,95 59,59 60,07 62,68 61,82 74,00 75,91 1.884 April May 1.924 June 1.960 1.931 76,75 81,01 78,69 74,68 74,70 76,43 79,71 76,77 75,07 73,58 75,50 76,47 76,27 87,54 85,88 84,98 83,93 82,25 78,05 75,86 July August September October 2.003 1.972 2.018 November 2.068 December 2.059 2013 1.995 73,61 January February March 2.105 2.068 76,83 82,07 78,83 79,29 2.086 April May 2.182 The data below presents monthly closing prices of Standard & Poor's 500 Index, Wal-Mart, and Target to calculate the holding-period returns for the 24 months from May 2011 through May 2013 Month S&P500 Walmart Target 2011 May 1.631 69,50 June 1.606 68,86 July 1.684 74,84 74,49 77,94 72,98 73,96 1.633 August September October 1.682 1.757 November 1.806 December 1.848 2012 1.783 January February March 1.859 1.872 71,25 63,31 63,98 64,79 63,93 63,27 56,64 62,54 60,51 61,75 56,76 57,95 59,59 60,07 62,68 61,82 74,00 75,91 1.884 April May 1.924 June 1.960 1.931 76,75 81,01 78,69 74,68 74,70 76,43 79,71 76,77 75,07 73,58 75,50 76,47 76,27 87,54 85,88 84,98 83,93 82,25 78,05 75,86 July August September October 2.003 1.972 2.018 November 2.068 December 2.059 2013 1.995 73,61 January February March 2.105 2.068 76,83 82,07 78,83 79,29 2.086 April May 2.182
Step by Step Solution
There are 3 Steps involved in it

Get step-by-step solutions from verified subject matter experts