

Question: You can find this case study in your course pack, please complete the assignment below: 1. Assuming Tottenham Hotspurs continue in their current stadium following
You can find this case study in your course pack, please complete the assignment below: 1. Assuming Tottenham Hotspurs continue in their current stadium following their current player strategy: Perform a DCF analysis using the cash flow projections given in the case. Based on this DCF analysis, what is the value of the Hotspurs? Perform a multiple analysis. Based on the multiples analysis, is the value of Tottenham any different? At its current stock price of 13.80, is Tottenham fairly valued? 2. Using a DCF approach, evaluate each of the following decisions: Build the new stadium Sign a new striker Build the new stadium and sign a new striker 3. Based on the results from 2, select a best choice and provide a logical argument to support it. Hints: There are multiple ways to find the answer; individual's answers may vary. Be sure to provide a logical reasoning for your assumptions. Exhibit 5 provides values for Discounted Cash Flows DCF can be done a couple ways, based on EBITDA or calculating Free Cash Flows If you use the Free Cash Flow Method, you will also need to include capital acquisitions by year and change the net working capital by year Regardless of method, you need to determine a terminal value of the business (the present value of a perpetuity) Use 10.25% as the discount rate Remember to determine the value you will need to subtract the value for debt For adding a new stadium and new striker, you need to adjust your original DCF model and find the new cash flows. Remember to adjust for related revenues and expenses and recalculate the value of the enterprise. Assume the Weighted Average Cost of Capital (WACC) is 10.25%
Exhibit 5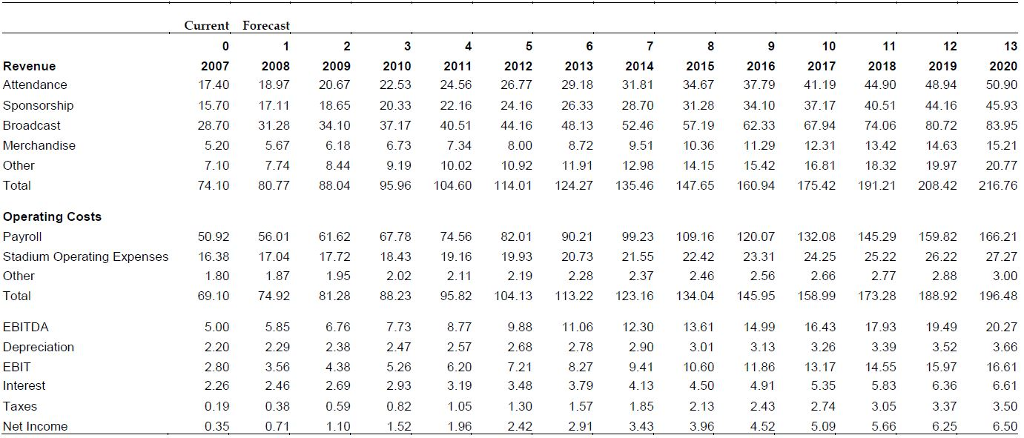
Exhibit 4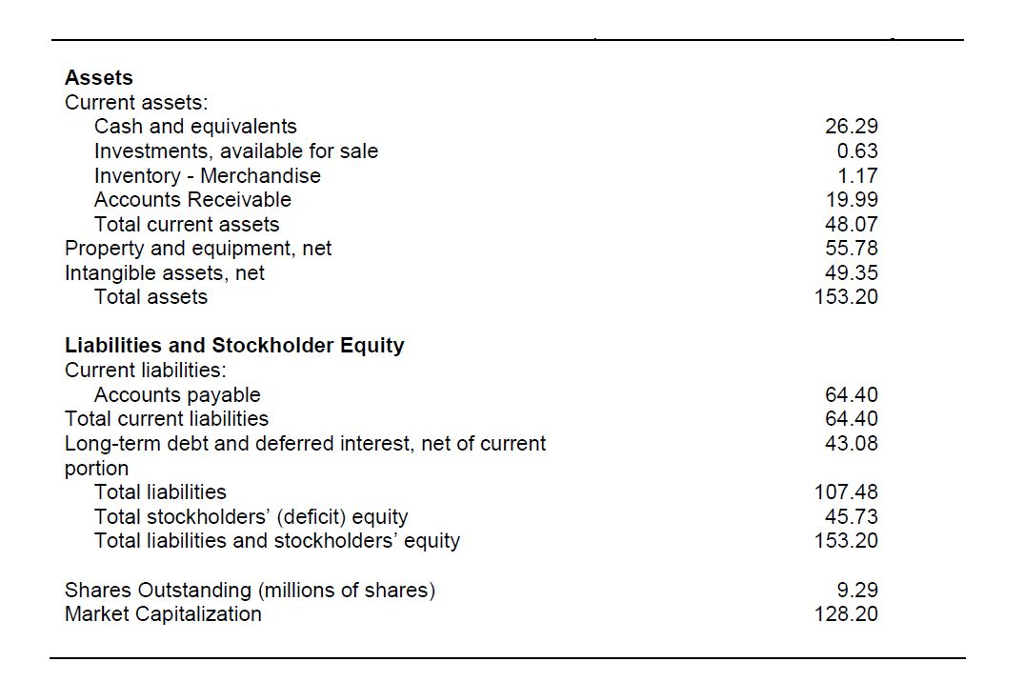
Current Forecast 13 2020 17.40 18.97 20.67 22.53 24.56 26.77 29.1831.8 34.67 37.79 41.19 44.90 48.94 50.90 15.70 171118.65 20.33 22.16 24.16 26.33 28.70 31.28 34.10 37.17 40.5 44.16 45.93 28.70 31.28 34.10 37.17 40.51 44.16 48.13 52.46 57.19 62.33 67.94 74.06 80.72 83.95 9.51 10.36 11.29 1.31 13.42 14.63 15.21 9.19 10.02 10.92 11.91 12.98 14.15 15.42 16.81 18.32 19.97 20.77 74.10 80.77 88.04 95.96 104.60 114.01 124.27 135.46 147.65 160.94 175.42 191.21 208.42 216.76 2007 2008 2009 2010 2011 2012 2013 2014 2016 2017 2018 2019 Revenue Attendance Sponsorship Broadcast Merchandise Other Total 2015 5.20 6.73 8.00 8.72 7.74 Operating Costs Payroll Stadium Operating Expenses 16.38 17.04 17.72 18.43 19.16 19.93 20.73 21.55 22.42 23.31 24.25 25.22 26.2227.27 Other Total 50.92 56.01 61.62 67.78 74.56 82.01 90.21 99.23109.16 120.07 132.08 145.29 159.82 166.21 1.80 69.10 74.92 81.28 88.23 95.82 104.13 113.22 123.16 134.04 145.95 158.99 173.28 188.92 196.48 2.02 2.28 2.66 2.77 7.73 EBITDA Depreciation EBIT Interest Taxes Net Income 5.00 2.20 6.76 8.77 2.57 6.20 9.88 1.06 12.30 13.61 14.99 16.43 7.93 19.49 20.27 2.68 7.21 3.39 2.78 8.27 3.79 3.26 9.41 10.60 1186 13.17 14.55 5.97 16.61 5.35 2.74 5.09 3.01 3.52 3.66 3.56 5.26 2.26 2.69 4.50 4.91 3.05 5.66 6.36 3.37 6.25 0.38 0.59 0.82 3.50 1.05 1.96 0.35 0.71 2.42 2.91 3.43 3.96 4.52 6.50 Assets Current assets Cash and equivalents Investments, available for sale Inventory - Merchandise Accounts Receivable 26.29 0.63 1.17 19.99 48.07 55.78 49.35 153.20 otal current assetS Property and equipment, net Intangible assets, net Total assets Liabilities and Stockholder Equity Current liabilities: Accounts payable Total current liabilities Long-term debt and deferred interest, net of current portion 64.40 64.40 43.08 Total liabilities Total stockholders' (deficit) equity Total liabilities and stockholders' equity 107.48 45.73 153.20 Shares Outstanding (millions of shares) Market Capitalization 9.29 128.20 Current Forecast 13 2020 17.40 18.97 20.67 22.53 24.56 26.77 29.1831.8 34.67 37.79 41.19 44.90 48.94 50.90 15.70 171118.65 20.33 22.16 24.16 26.33 28.70 31.28 34.10 37.17 40.5 44.16 45.93 28.70 31.28 34.10 37.17 40.51 44.16 48.13 52.46 57.19 62.33 67.94 74.06 80.72 83.95 9.51 10.36 11.29 1.31 13.42 14.63 15.21 9.19 10.02 10.92 11.91 12.98 14.15 15.42 16.81 18.32 19.97 20.77 74.10 80.77 88.04 95.96 104.60 114.01 124.27 135.46 147.65 160.94 175.42 191.21 208.42 216.76 2007 2008 2009 2010 2011 2012 2013 2014 2016 2017 2018 2019 Revenue Attendance Sponsorship Broadcast Merchandise Other Total 2015 5.20 6.73 8.00 8.72 7.74 Operating Costs Payroll Stadium Operating Expenses 16.38 17.04 17.72 18.43 19.16 19.93 20.73 21.55 22.42 23.31 24.25 25.22 26.2227.27 Other Total 50.92 56.01 61.62 67.78 74.56 82.01 90.21 99.23109.16 120.07 132.08 145.29 159.82 166.21 1.80 69.10 74.92 81.28 88.23 95.82 104.13 113.22 123.16 134.04 145.95 158.99 173.28 188.92 196.48 2.02 2.28 2.66 2.77 7.73 EBITDA Depreciation EBIT Interest Taxes Net Income 5.00 2.20 6.76 8.77 2.57 6.20 9.88 1.06 12.30 13.61 14.99 16.43 7.93 19.49 20.27 2.68 7.21 3.39 2.78 8.27 3.79 3.26 9.41 10.60 1186 13.17 14.55 5.97 16.61 5.35 2.74 5.09 3.01 3.52 3.66 3.56 5.26 2.26 2.69 4.50 4.91 3.05 5.66 6.36 3.37 6.25 0.38 0.59 0.82 3.50 1.05 1.96 0.35 0.71 2.42 2.91 3.43 3.96 4.52 6.50 Assets Current assets Cash and equivalents Investments, available for sale Inventory - Merchandise Accounts Receivable 26.29 0.63 1.17 19.99 48.07 55.78 49.35 153.20 otal current assetS Property and equipment, net Intangible assets, net Total assets Liabilities and Stockholder Equity Current liabilities: Accounts payable Total current liabilities Long-term debt and deferred interest, net of current portion 64.40 64.40 43.08 Total liabilities Total stockholders' (deficit) equity Total liabilities and stockholders' equity 107.48 45.73 153.20 Shares Outstanding (millions of shares) Market Capitalization 9.29 128.20
Step by Step Solution
There are 3 Steps involved in it

Get step-by-step solutions from verified subject matter experts