

Question: YOU CAN ONLY ANSWER BY USING THE TABLE BELOW. TABLE: P1 USE TABLE 2 TO ANSWER THE FOLLOWING QUESTIONS: A) In this article, What type
YOU CAN ONLY ANSWER BY USING THE TABLE BELOW.
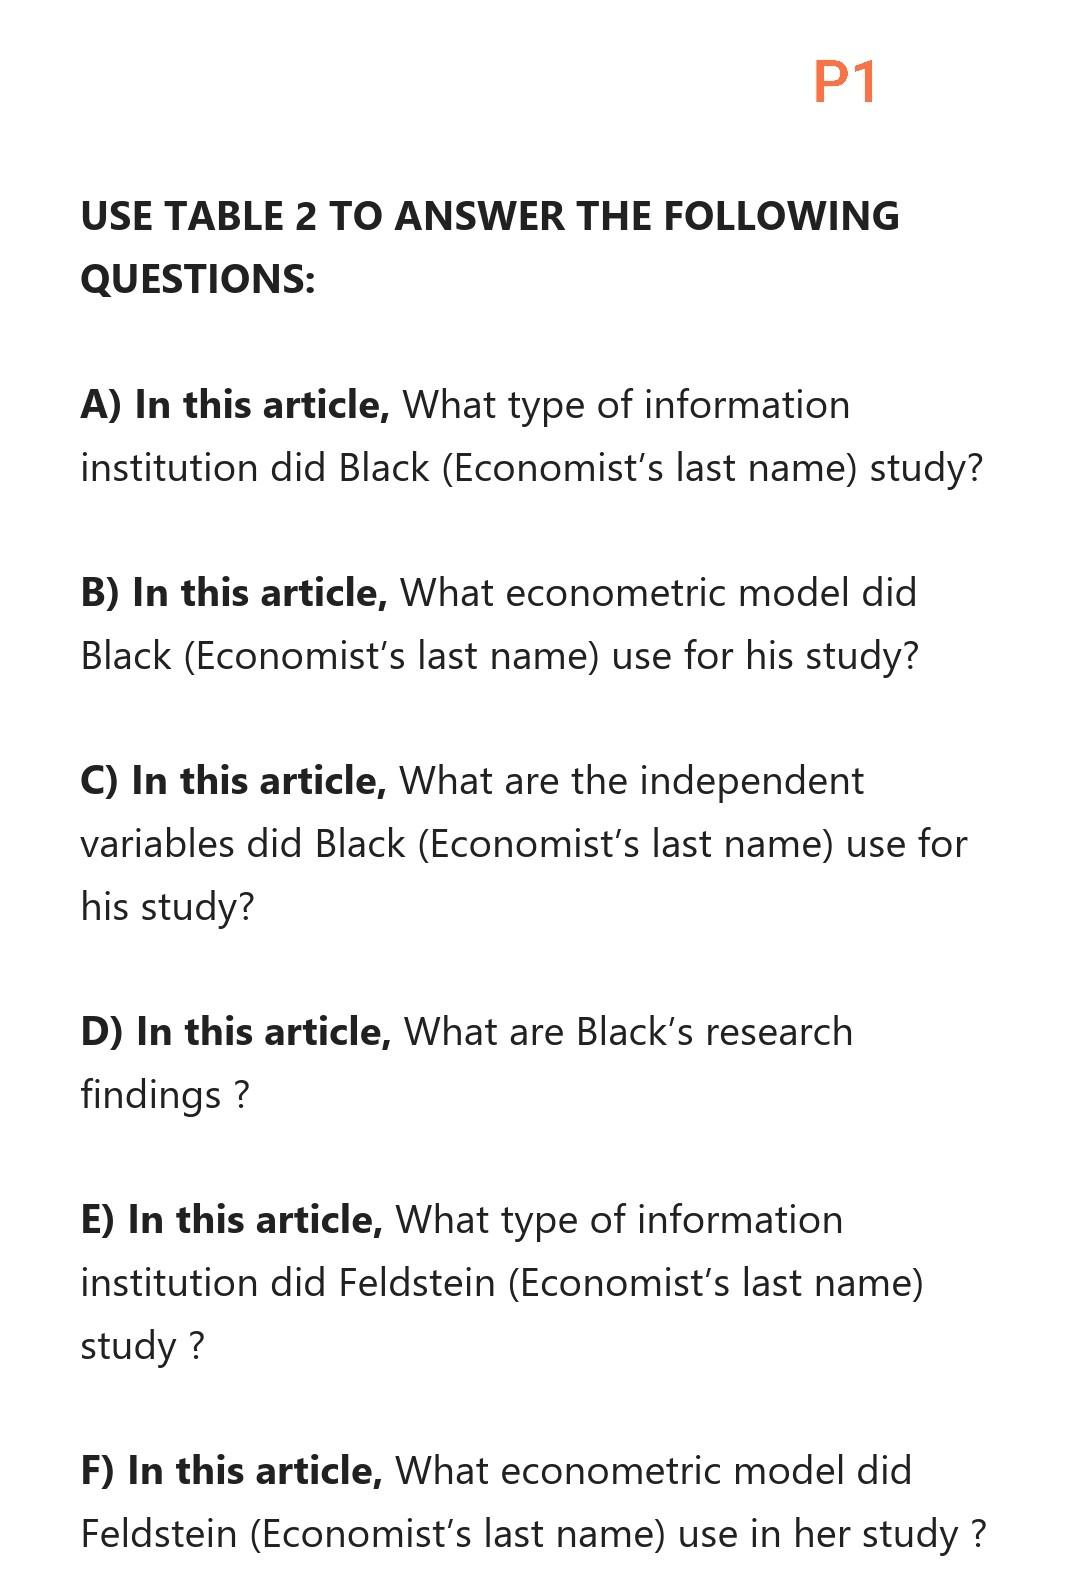
TABLE:
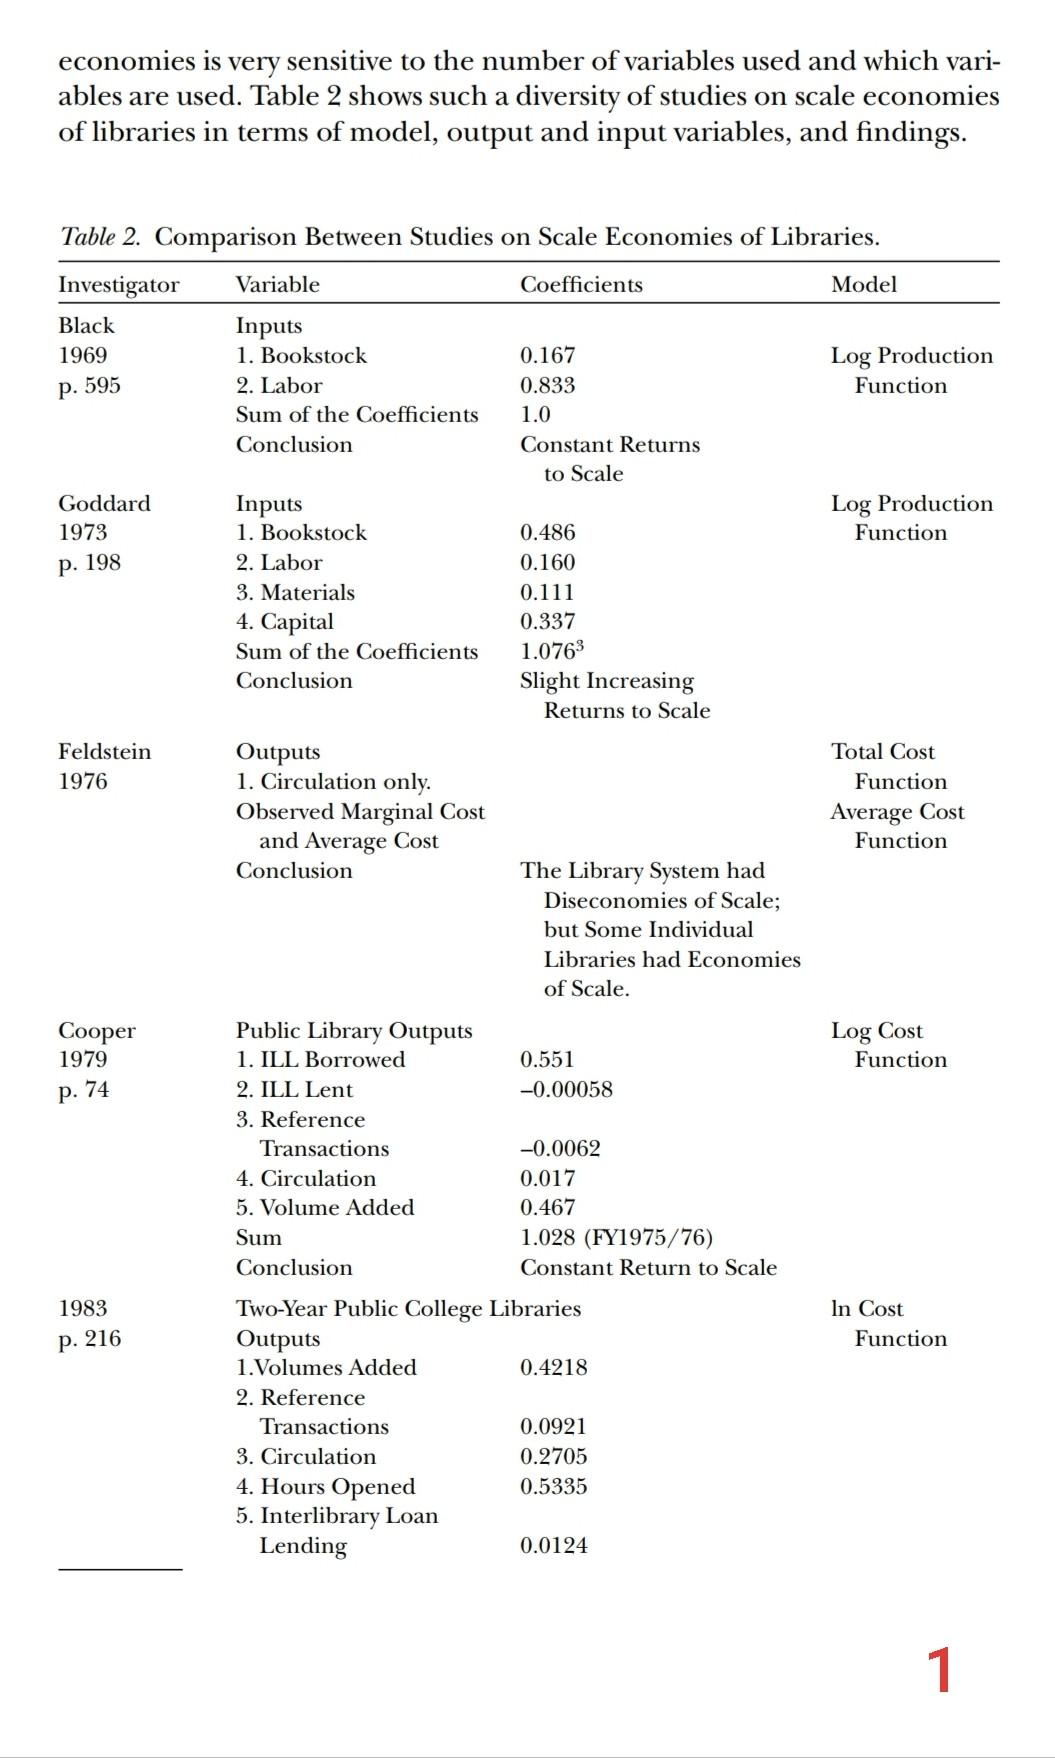
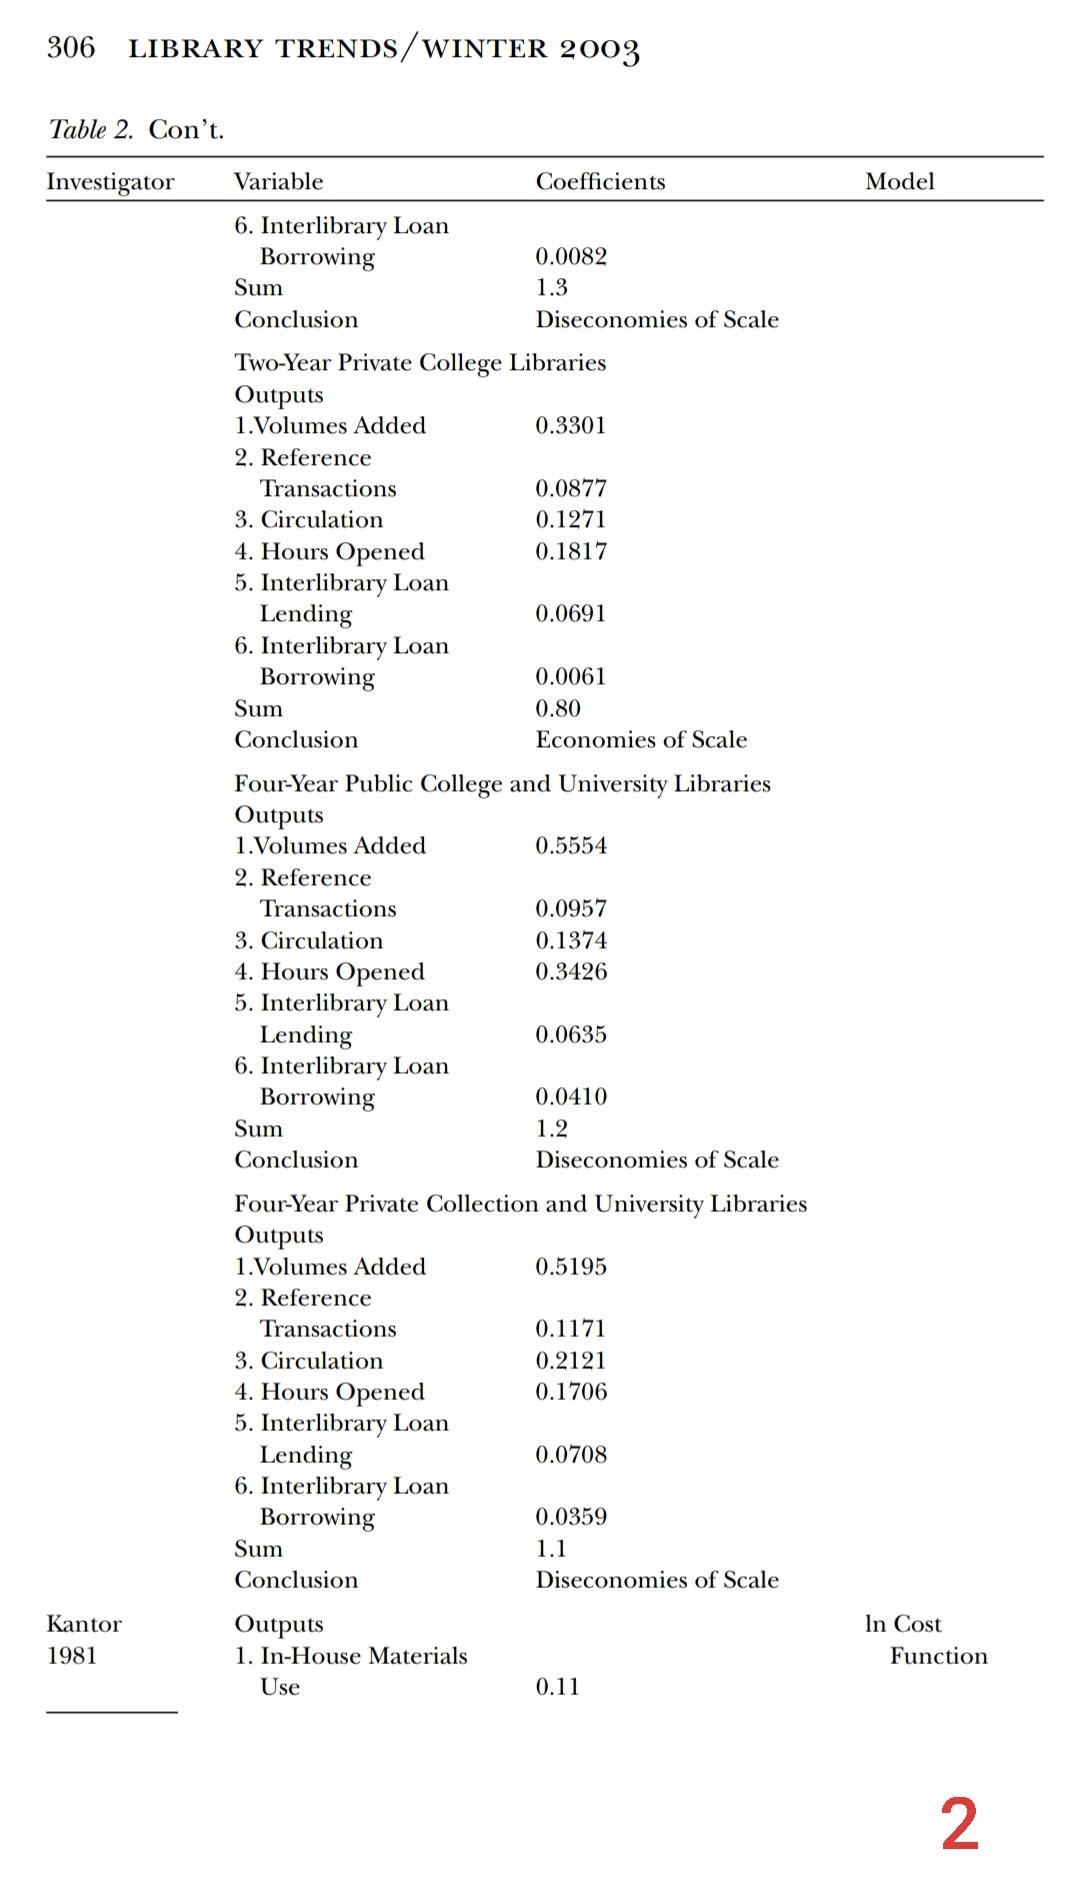
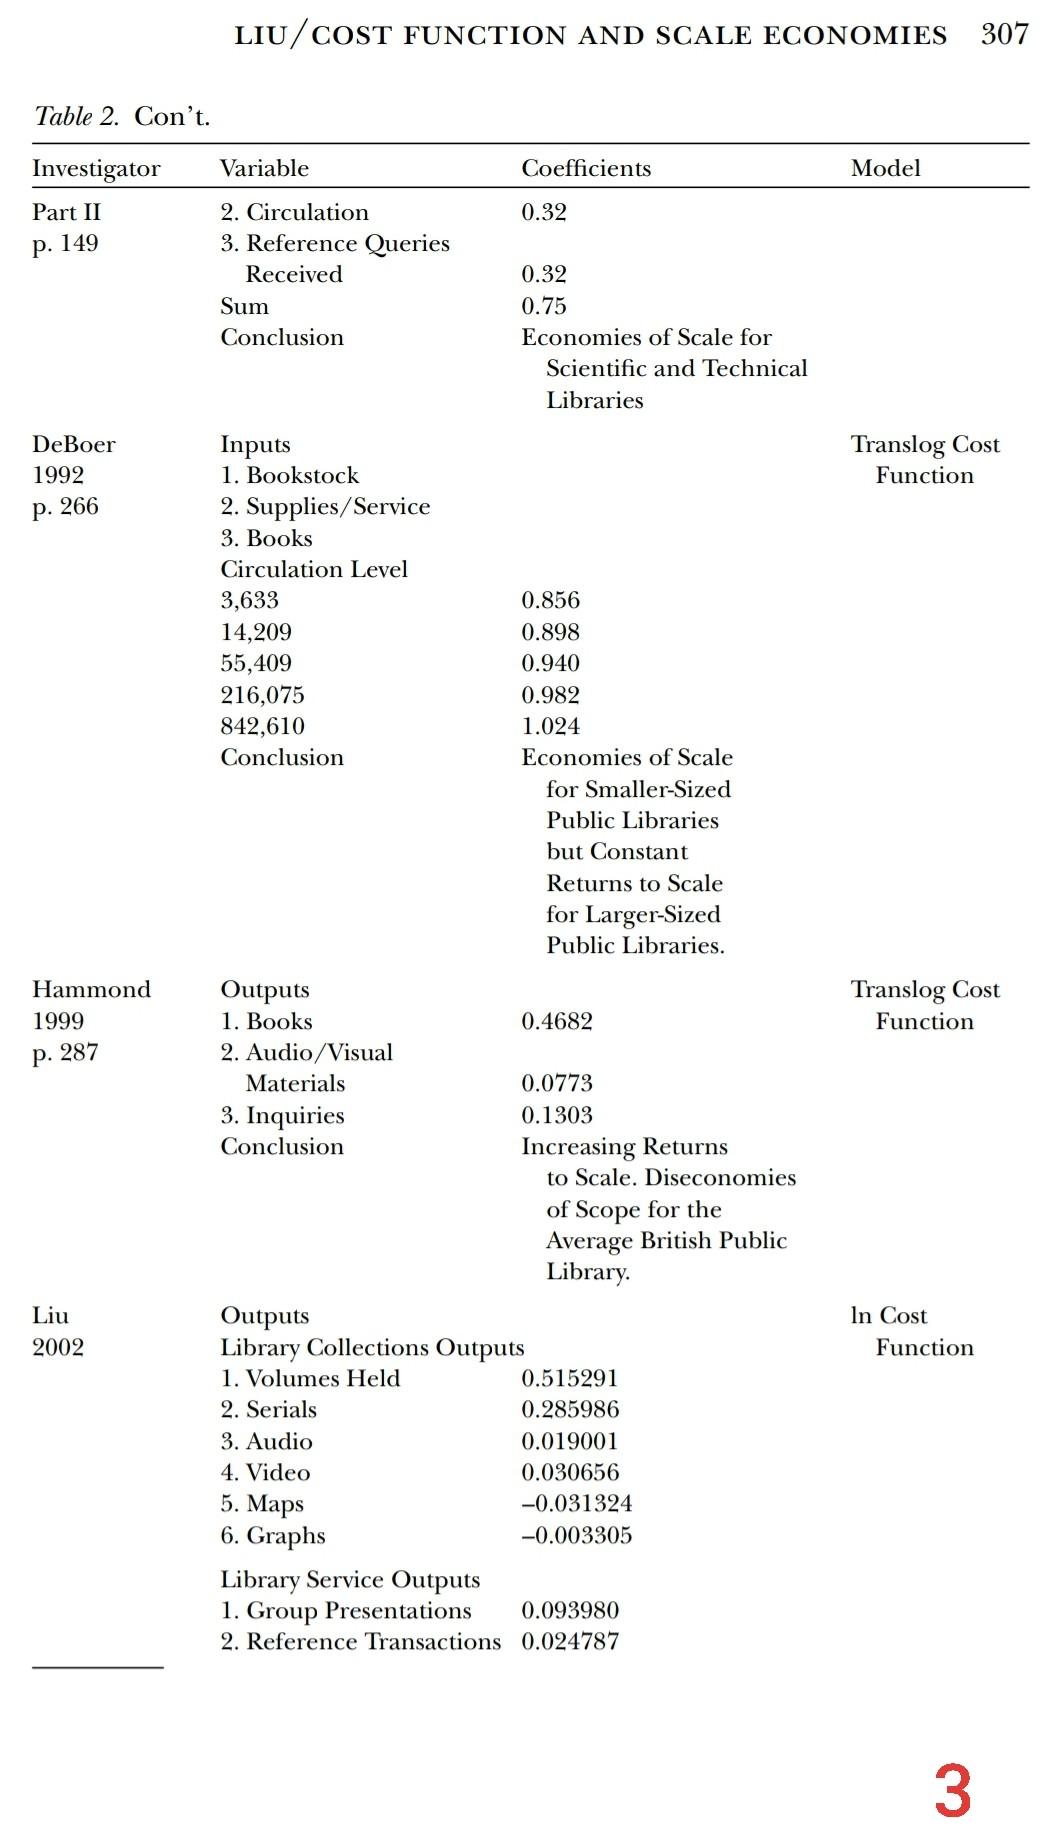
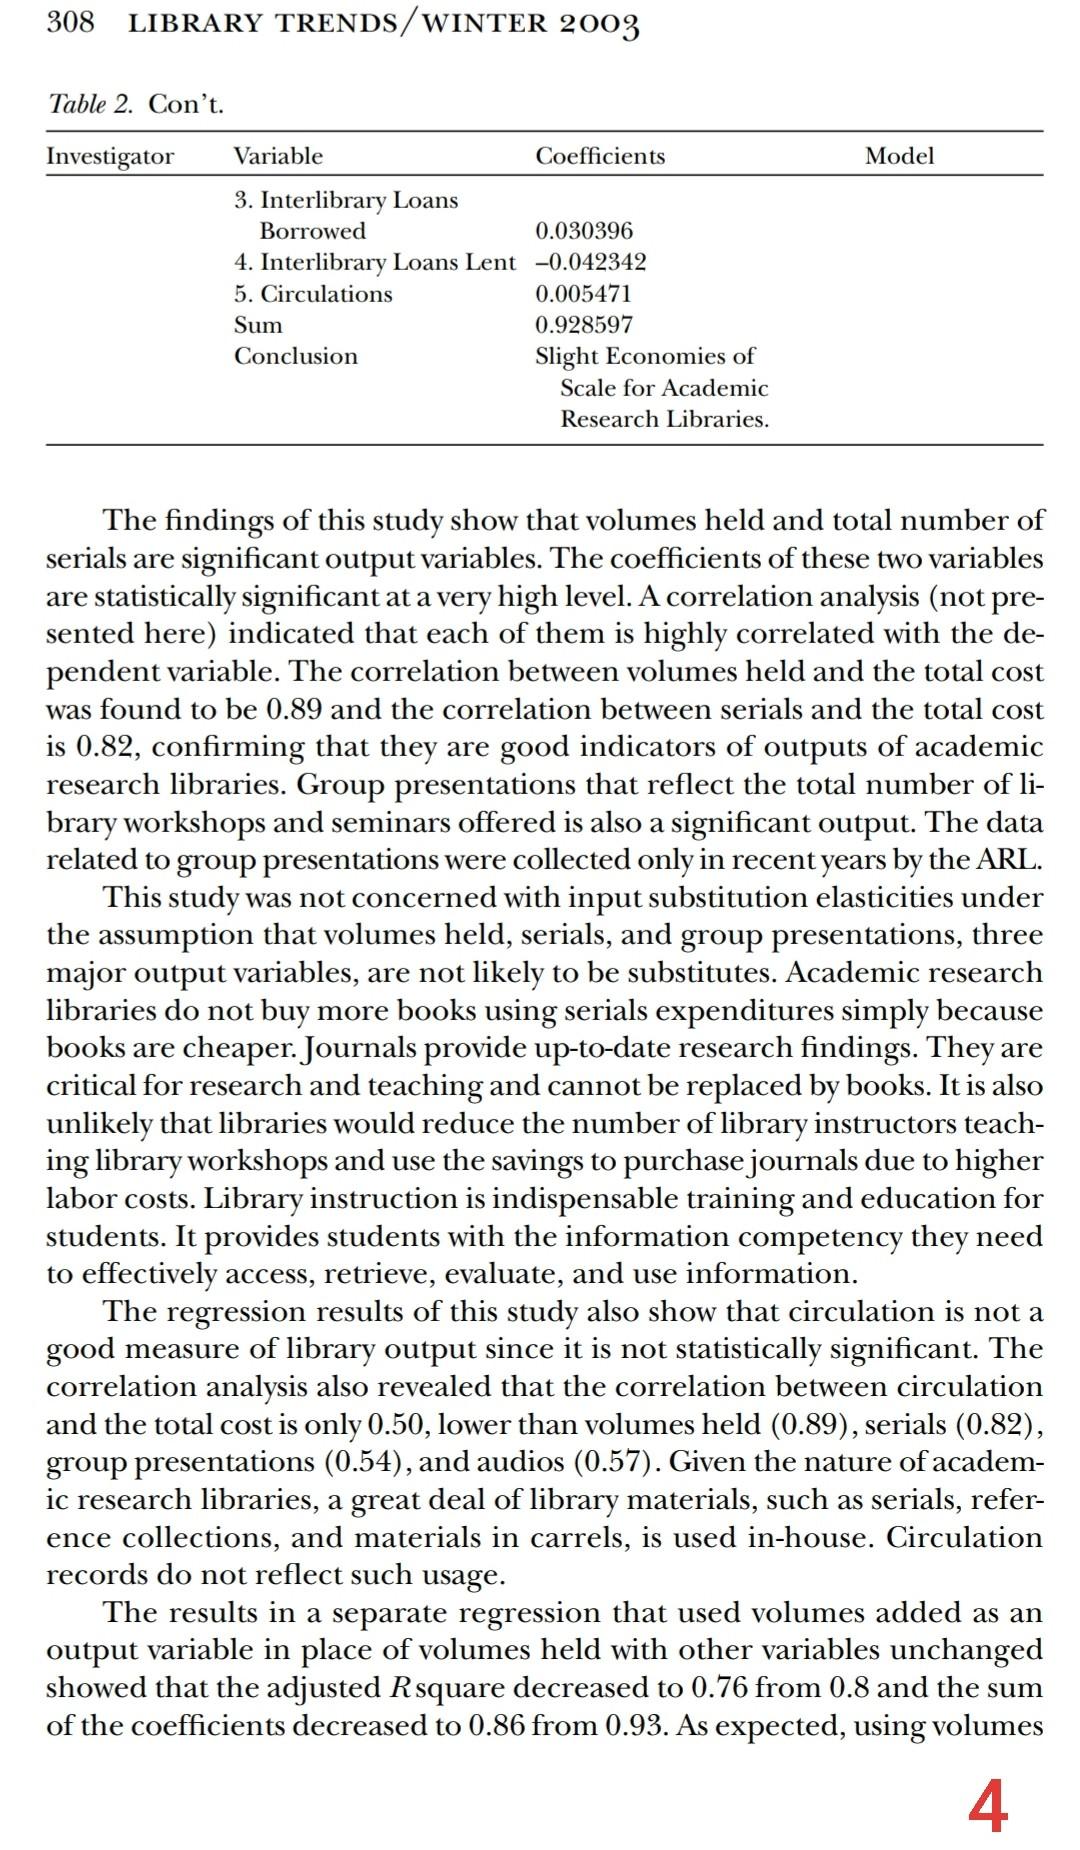
P1 USE TABLE 2 TO ANSWER THE FOLLOWING QUESTIONS: A) In this article, What type of information institution did Black (Economist's last name) study? B) In this article, What econometric model did Black (Economist's last name) use for his study? C) In this article, What are the independent variables did Black (Economist's last name) use for his study? D) In this article, What are Black's research findings ? E) In this article, What type of information institution did Feldstein (Economist's last name) study? F) In this article, What econometric model did Feldstein (Economist's last name) use in her study ? economies is very sensitive to the number of variables used and which vari- ables are used. Table 2 shows such a diversity of studies on scale economies of libraries in terms of model, output and input variables, and findings. p. 595 p. 198 Table 2. Comparison Between Studies on Scale Economies of Libraries. Investigator Variable Coefficients Model Black Inputs 1969 1. Bookstock 0.167 Log Production 2. Labor 0.833 Function Sum of the Coefficients 1.0 Conclusion Constant Returns to Scale Goddard Inputs Log Production 1973 1. Bookstock 0.486 Function 2. Labor 0.160 3. Materials 0.111 4. Capital 0.337 Sum of the Coefficients 1.0763 Conclusion Slight Increasing Returns to Scale Feldstein Outputs Total Cost 1976 1. Circulation only. Function Observed Marginal Cost Average Cost and Average Cost Function Conclusion The Library System had Diseconomies of Scale; but Some Individual Libraries had Economies of Scale. Cooper 1979 Log Cost Function 0.551 -0.00058 p. 74 Public Library Outputs 1. ILL Borrowed 2. ILL Lent 3. Reference Transactions 4. Circulation 5. Volume Added Sum Conclusion -0.0062 0.017 0.467 1.028 (FY1975/76) Constant Return to Scale 1983 In Cost Function p. 216 Two-Year Public College Libraries Outputs 1. Volumes Added 0.4218 2. Reference Transactions 0.0921 3. Circulation 0.2705 4. Hours Opened 0.5335 5. Interlibrary Loan Lending 0.0124 1 306 LIBRARY TRENDS/WINTER 2003 Table 2. Con't. Investigator Variable Coefficients Model 6. Interlibrary Loan Borrowing Sum Conclusion 0.0082 1.3 Diseconomies of Scale Two-Year Private College Libraries Outputs 1. Volumes Added 0.3301 2. Reference Transactions 0.0877 3. Circulation 0.1271 4. Hours Opened 0.1817 5. Interlibrary Loan Lending 0.0691 6. Interlibrary Loan Borrowing 0.0061 Sum 0.80 Conclusion Economies of Scale Four-Year Public College and University Libraries Outputs 1. Volumes Added 0.5554 2. Reference Transactions 0.0957 3. Circulation 0.1374 4. Hours Opened 0.3426 5. Interlibrary Loan Lending 0.0635 6. Interlibrary Loan Borrowing 0.0410 Sum 1.2 Conclusion Diseconomies of Scale Four-Year Private Collection and University Libraries Outputs 1. Volumes Added 0.5195 2. Reference Transactions 0.1171 3. Circulation 0.2121 4. Hours Opened 0.1706 5. Interlibrary Loan Lending 0.0708 6. Interlibrary Loan Borrowing 0.0359 Sum Conclusion Diseconomies of Scale 1.1 Kantor 1981 Outputs 1. In-House Materials Use In Cost Function 0.11 2 LIU/COST FUNCTION AND SCALE ECONOMIES 307 Table 2. Con't. Investigator Variable Coefficients Model Part II 0.32 p. 149 2. Circulation 3. Reference Queries Received Sum Conclusion 0.32 0.75 Economies of Scale for Scientific and Technical Libraries De Boer 1992 Translog Cost Function p. 266 Inputs 1. Bookstock 2. Supplies/Service 3. Books Circulation Level 3,633 14,209 55,409 216,075 842,610 Conclusion 0.856 0.898 0.940 0.982 1.024 Economies of Scale for Smaller-Sized Public Libraries but Constant Returns to Scale for Larger-Sized Public Libraries. Hammond 1999 Translog Cost Function p. 287 Liu 2002 Outputs 1. Books 0.4682 2. Audio Visual Materials 0.0773 3. Inquiries 0.1303 Conclusion Increasing Returns to Scale. Diseconomies of Scope for the Average British Public Library. Outputs Library Collections Outputs 1. Volumes Held 0.515291 2. Serials 0.285986 3. Audio 0.019001 4. Video 0.030656 -0.031324 6. Graphs -0.003305 Library Service Outputs 1. Group Presentations 0.093980 2. Reference Transactions 0.024787 In Cost Function 5. Maps 3 308 LIBRARY TRENDS/WINTER 2003 Table 2. Con't. Investigator Variable Coefficients Model 3. Interlibrary Loans Borrowed 0.030396 4. Interlibrary Loans Lent -0.042342 5. Circulations 0.005471 Sum 0.928597 Conclusion Slight Economies of Scale for Academic Research Libraries. The findings of this study show that volumes held and total number of serials are significant output variables. The coefficients of these two variables are statistically significant at a very high level. A correlation analysis (not pre- sented here) indicated that each of them is highly correlated with the de- pendent variable. The correlation between volumes held and the total cost was found to be 0.89 and the correlation between serials and the total cost is 0.82, confirming that they are good indicators of outputs of academic research libraries. Group presentations that reflect the total number of li- brary workshops and seminars offered is also a significant output. The data related to group presentations were collected only in recent years by the ARL. This study was not concerned with input substitution elasticities under the assumption that volumes held, serials, and group presentations, three major output variables, are not likely to be substitutes. Academic research libraries do not buy more books using serials expenditures simply because books are cheaper. Journals provide up-to-date research findings. They are critical for research and teaching and cannot be replaced by books. It is also unlikely that libraries would reduce the number of library instructors teach- ing library workshops and use the savings to purchase journals due to higher labor costs. Library instruction is indispensable training and education for students. It provides students with the information competency they need to effectively access, retrieve, evaluate, and use information. The regression results of this study also show that circulation is not a good measure of library output since it is not statistically significant. The correlation analysis also revealed that the correlation between circulation and the total cost is only 0.50, lower than volumes held (0.89), serials (0.82), group presentations (0.54), and audios (0.57). Given the nature of academ- ic research libraries, a great deal of library materials, such as serials, refer- ence collections, and materials in carrels, is used in-house. Circulation records do not reflect such usage. The results in a separate regression that used volumes added as an output variable in place of volumes held with other variables unchanged showed that the adjusted Rsquare decreased to 0.76 from 0.8 and the sum of the coefficients decreased to 0.86 from 0.93. As expected, using volumes 4
Step by Step Solution
There are 3 Steps involved in it
1 Expert Approved Answer
Step: 1 Unlock

Question Has Been Solved by an Expert!
Get step-by-step solutions from verified subject matter experts
Step: 2 Unlock
Step: 3 Unlock