

Question: You can use either Excel or manually calculate returns, standard deviations, covariance, and correlation coefficient using the formulas illustrated on Power Point slides. However, you
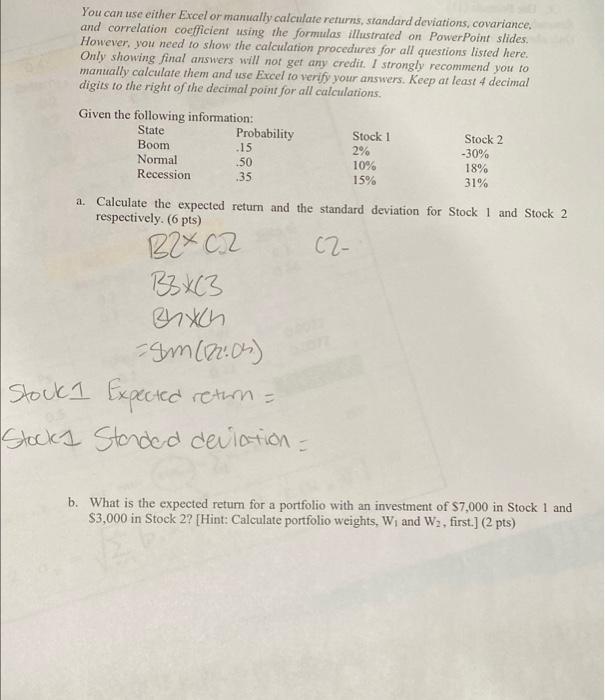
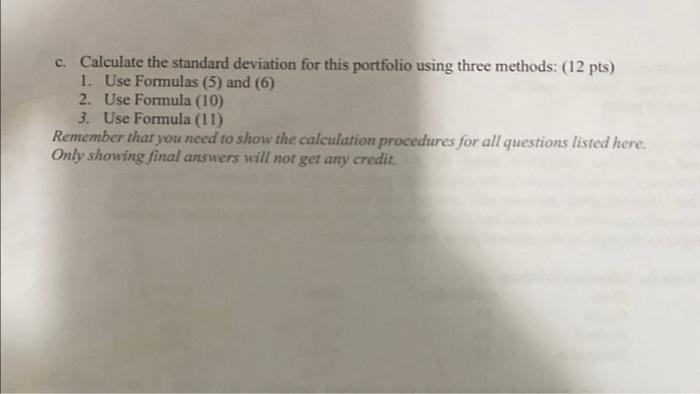
You can use either Excel or manually calculate returns, standard deviations, covariance, and correlation coefficient using the formulas illustrated on Power Point slides. However, you need to show the calculation procedures for all questions listed here. Only showing final answers will not get any credit. I strongly recommend you to mamually calculate them and use Excel to verify your answers. Keep at least 4 decimal digits to the right of the decimal point for all calculations. Given the following information: State Probability Stock 1 Stock 2 Boom .15 2% -30% Normal .50 10% 18% Recession .35 15% 31% a. Calculate the expected return and the standard deviation for Stock 1 and Stock 2 respectively. (6 pts) C2- B2%C2 B3XC3 Bitch am (2:0) Stock I expected return = Stocks Stended deviation - b. What is the expected return for a portfolio with an investment of $7,000 in Stock I and $3,000 in Stock 2? (Hint: Calculate portfolio weights, W. and W2, first.] (2 pts) c. Calculate the standard deviation for this portfolio using three methods: (12 pts) 1. Use Formulas (5) and (6) 2. Use Formula (10) 3. Use Formula (11) Remember that you need to show the calculation procedures for all questions listed here. Only showing final answers will not get any credit
Step by Step Solution
There are 3 Steps involved in it

Get step-by-step solutions from verified subject matter experts