

Question: You can use Excel spreadsheet Consider the following table: Bond Fund Rate of Fund Scenario Probability .05 0.25 0.40 0.30 Rate of Return Severe recession
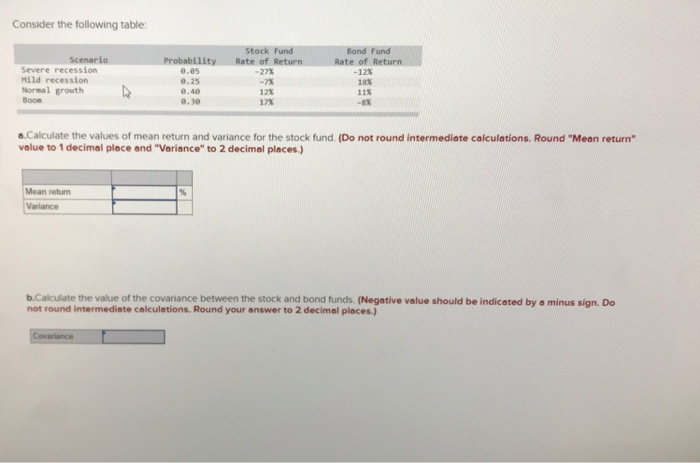
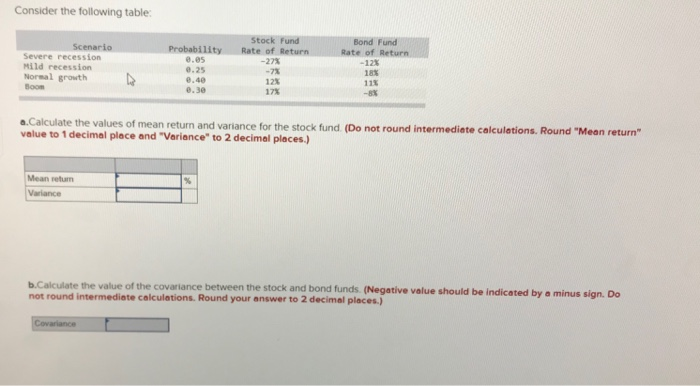
Consider the following table: Bond Fund Rate of Fund Scenario Probability .05 0.25 0.40 0.30 Rate of Return Severe recession Mild recession Normal growth Boom -12% 18% -27% 12% 17% -8% a.Calculate the values of mean return and variance for the stock fund. (Do not round intermediate calculations. Round "Mean return" value to 1 decimal place and "Variance" to 2 decimal places) Mean return b.Calculate the value of the covariance between the stock and bond funds (Negative value should be indicated by a minus sign. Do not round intermediate calculations. Round your answer to 2 decimal places.) Consider the following table Bond Fund Rate of Return -12% 18% 11% Probability Rate of Severe recession Mild recession .es 0-25 .40 -27% Normal growth Boom 12% 17% 0.30 a.Calculate the values of mean return and variance for the stock value to 1 decimal place and "Variance" to 2 decimel places.) not r Mean retun Variance b.Calculate the value of the covariance between the stock and bond funds. (Negative value should be indicated not round intermediate celculations. Round your answer to 2 decimal places.) by a minus sign. Do
Step by Step Solution
There are 3 Steps involved in it

Get step-by-step solutions from verified subject matter experts