

Question: you can use the online graph paper Chapter 2: Demand, Supply & Market Equilibrium 10. Table 2 and Table 3 are the demand and supply
you can use the online graph paper
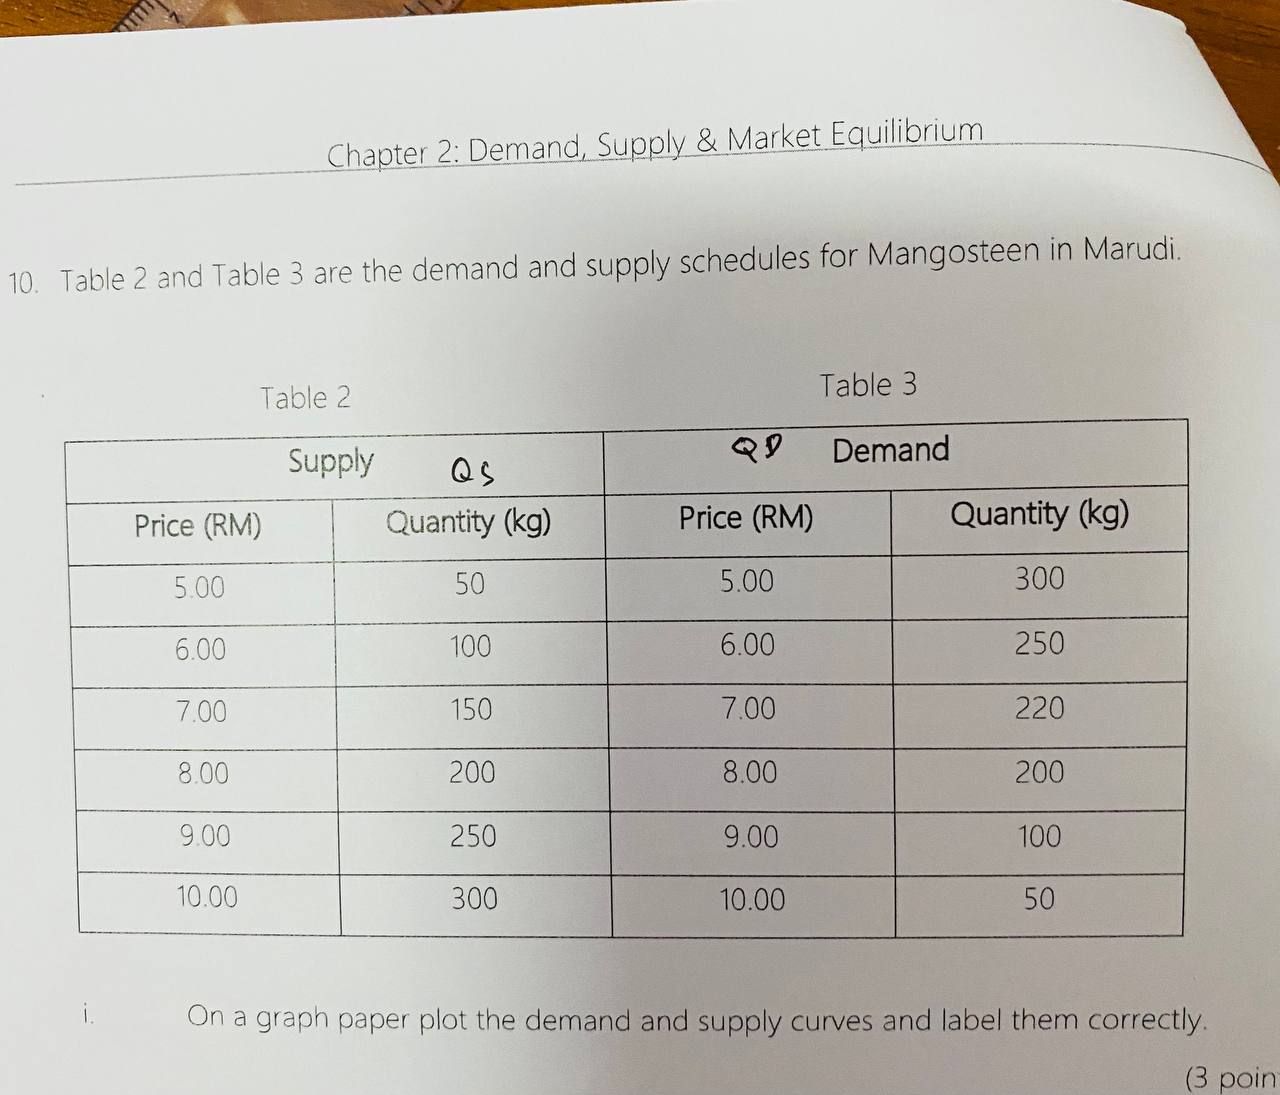
Chapter 2: Demand, Supply & Market Equilibrium 10. Table 2 and Table 3 are the demand and supply schedules for Mangosteen in Marudi. Table 2 Table 3 Supply Qs Demand Price (RM) Quantity (kg) Price (RM) Quantity (kg) 5.00 50 5.00 300 6.00 100 6.00 250 7.00 150 7.00 220 8.00 200 8.00 200 9.00 250 9.00 100 10.00 300 10.00 50 1 . On a graph paper plot the demand and supply curves and label them correctly. (3 poin
Step by Step Solution
There are 3 Steps involved in it
1 Expert Approved Answer
Step: 1 Unlock

Question Has Been Solved by an Expert!
Get step-by-step solutions from verified subject matter experts
Step: 2 Unlock
Step: 3 Unlock