

Question: You examined consumer satisfaction with ride sharing apps in relation to price and car comfort. You measures satisfaction on an interval scale where 1 =
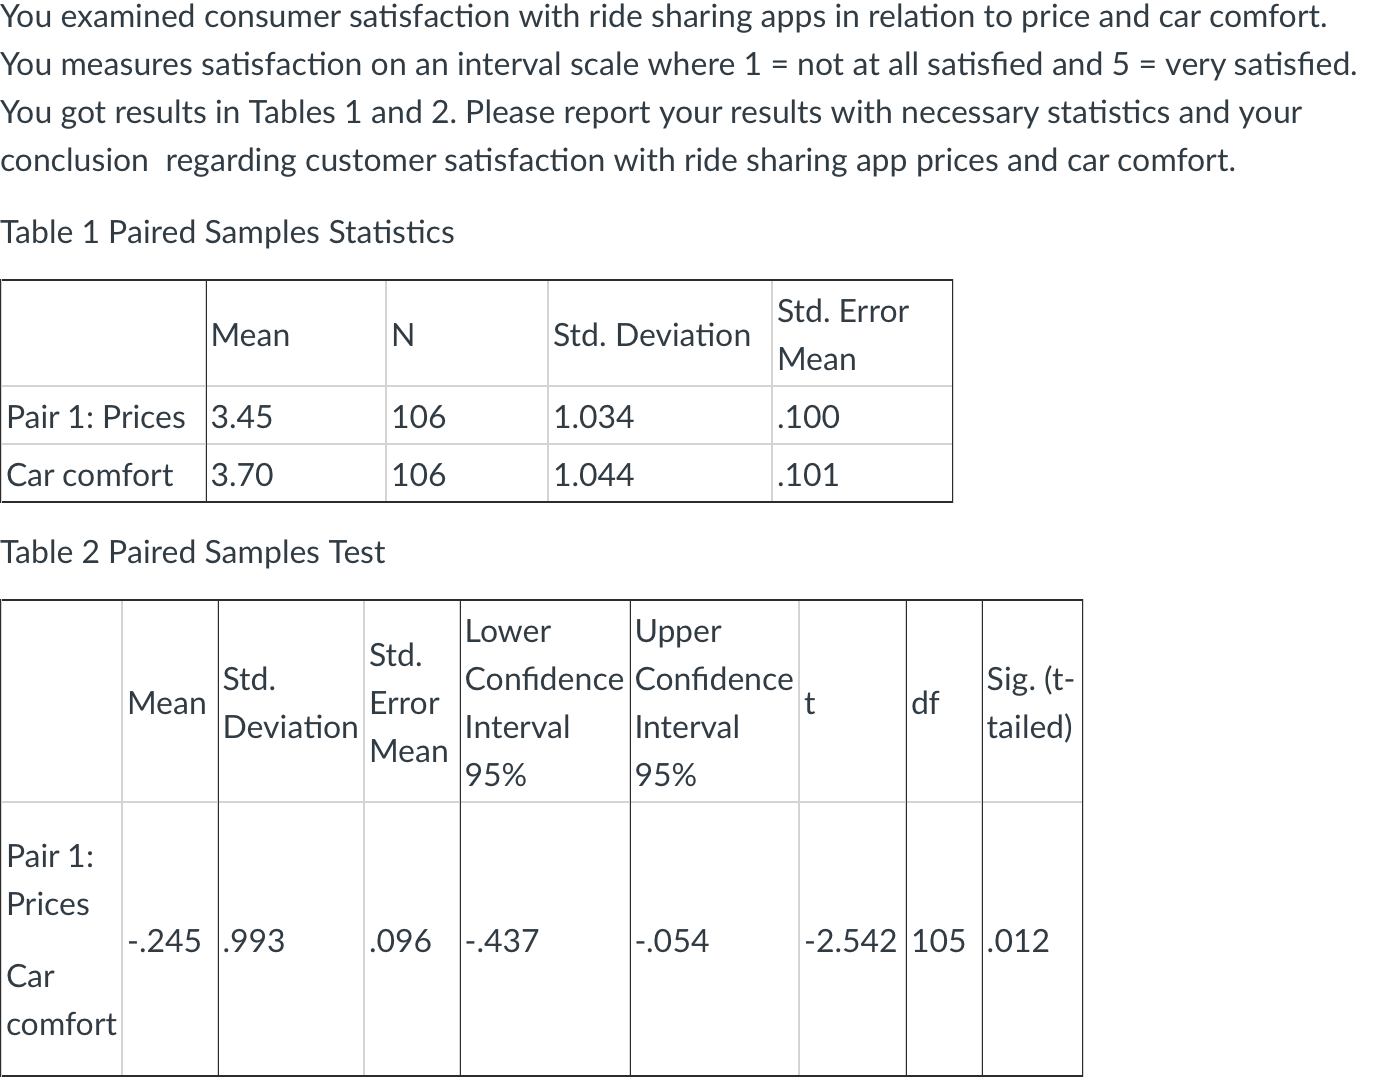
You examined consumer satisfaction with ride sharing apps in relation to price and car comfort. You measures satisfaction on an interval scale where 1 = not at all satisfied and 5 = very satisfied. You got results in Tables 1 and 2. Please report your results with necessary statistics and your conclusion regarding customer satisfaction with ride sharing app prices and car comfort. Table 1 Paired Samples Statistics Std. Error Mean N Std. Deviation Mean Pair 1: Prices 3.45 106 1.034 100 Car comfort 3.70 106 1.044 .101 Table 2 Paired Samples Test Lower Upper Std. Std. Confidence Confidence Sig. (t- Mean Error t df Deviation Interval Interval tailed) Mean 95% 95% Pair 1: Prices -.245 .993 096 -.437 -.054 -2.542 105 .012 Car comfort
Step by Step Solution
There are 3 Steps involved in it

Get step-by-step solutions from verified subject matter experts