

Question: You generate a scatter plot using Excel. You then have Excel plot the trend line and report the equaon and the :3 'u'EllUE. The regression
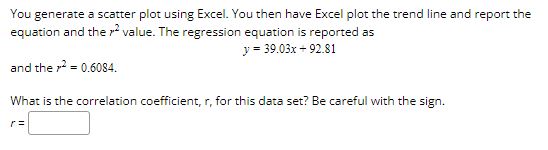
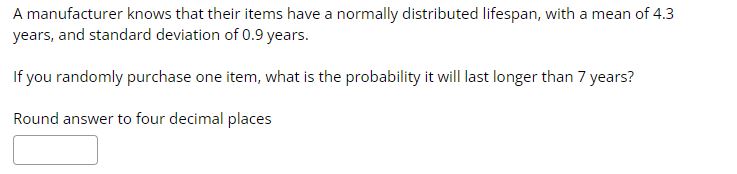
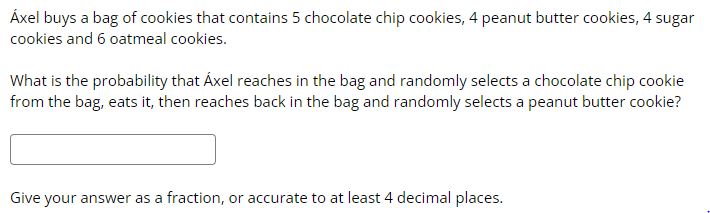
You generate a scatter plot using Excel. You then have Excel plot the trend line and report the equaon and the :3 'u'EllUE. The regression equation is reported as y = 39.03:: -i- 92.81 and the r3 = 0.6034. What is the correlation coefficient, r, 'For this data set? Be careful with the sign. A manufacturer knows that their items have a normally distributed lifespan, with a mean of4.3 years. and standard deviation of 0.9 years. If you randomly purchase one item, what is the probability it will last longerthan T years? Round answer to four decimal places [:1 er buys a bag of cookies that contains 5 chocolate chip cookies, 4 peanut butter cookies. 4 sugar cookies and E oatmeal cookies. 1What is the probability that xel reaches in the bag and randomly selects a chocolate chip cookie from the bag, eats it, then reaches back in the bag and randomly selects a peanut butter cookie? Give your answer as a fraction, or accurate to at least 4 decimal places
Step by Step Solution
There are 3 Steps involved in it

Get step-by-step solutions from verified subject matter experts