

Question: You graph the function f(x) = 300(1.015)*, which gives the total amount in your account after x years of interest that is compounded annually.
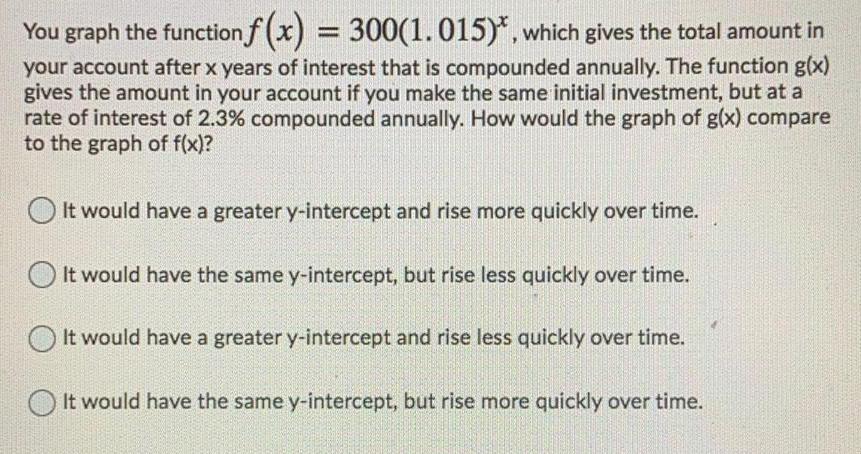
You graph the function f(x) = 300(1.015)*, which gives the total amount in your account after x years of interest that is compounded annually. The function g(x) gives the amount in your account if you make the same initial investment, but at a rate of interest of 2.3% compounded annually. How would the graph of g(x) compare to the graph of f(x)? It would have a greater y-intercept and rise more quickly over time. It would have the same y-intercept, but rise less quickly over time. It would have a greater y-intercept and rise less quickly over time. It would have the same y-intercept, but rise more quickly over time.
Step by Step Solution
There are 3 Steps involved in it

Get step-by-step solutions from verified subject matter experts