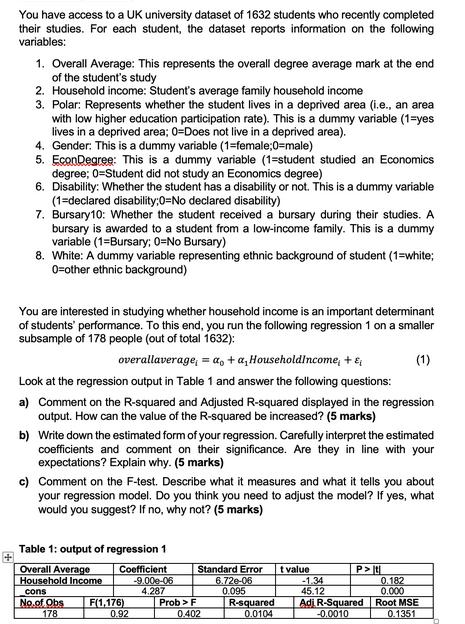
You have access to a UK university dataset of 1632 students who recently completed their studies....
Fantastic news! We've Found the answer you've been seeking!
Question:
Transcribed Image Text:
You have access to a UK university dataset of 1632 students who recently completed their studies. For each student, the dataset reports information on the following variables: 1. Overall Average: This represents the overall degree average mark at the end of the student's study 2. Household income: Student's average family household income 3. Polar: Represents whether the student lives in a deprived area (i.e., an area with low higher education participation rate). This is a dummy variable (1=yes lives in a deprived area; 0=Does not live in a deprived area). 4. Gender: This is a dummy variable (1-female;0=male) 5. EconDegree: This is a dummy variable (1-student studied an Economics degree; 0=Student did not study an Economics degree) 6. Disability: Whether the student has a disability or not. This is a dummy variable (1=declared disability;0=No declared disability) 7. Bursary10: Whether the student received a bursary during their studies. A bursary is awarded to a student from a low-income family. This is a dummy variable (1=Bursary; 0=No Bursary) 8. White: A dummy variable representing ethnic background of student (1-white; 0=other ethnic background) You are interested in studying whether household income is an important determinant of students performance. To this end, you run the following regression 1 on a smaller subsample of 178 people (out of total 1632): (1) overallaverage, = a + a, HouseholdIncome, + & Look at the regression output in Table 1 and answer the following questions: a) Comment on the R-squared and Adjusted R-squared displayed in the regression output. How can the value of the R-squared be increased? (5 marks) b) Write down the estimated form of your regression. Carefully interpret the estimated coefficients and comment on their significance. Are they in line with your expectations? Explain why. (5 marks) c) Comment on the F-test. Describe what it measures and what it tells you about your regression model. Do you think you need to adjust the model? If yes, what would you suggest? If no, why not? (5 marks) Table 1: output of regression 1 Overall Average Household Income cons No.of Obs 178 Coefficient F(1,176) 0.92 -9.00-06 4.287 Standard Error 6.72e-06 Prob > F 0.402 0.095 R-squared 0.0104 t value P>It -1.34 45.12 Adi R-Squared -0.0010 0.182 0.000 Root MSE 0.1351 You have access to a UK university dataset of 1632 students who recently completed their studies. For each student, the dataset reports information on the following variables: 1. Overall Average: This represents the overall degree average mark at the end of the student's study 2. Household income: Student's average family household income 3. Polar: Represents whether the student lives in a deprived area (i.e., an area with low higher education participation rate). This is a dummy variable (1=yes lives in a deprived area; 0=Does not live in a deprived area). 4. Gender: This is a dummy variable (1-female;0=male) 5. EconDegree: This is a dummy variable (1-student studied an Economics degree; 0=Student did not study an Economics degree) 6. Disability: Whether the student has a disability or not. This is a dummy variable (1=declared disability;0=No declared disability) 7. Bursary10: Whether the student received a bursary during their studies. A bursary is awarded to a student from a low-income family. This is a dummy variable (1=Bursary; 0=No Bursary) 8. White: A dummy variable representing ethnic background of student (1-white; 0=other ethnic background) You are interested in studying whether household income is an important determinant of students performance. To this end, you run the following regression 1 on a smaller subsample of 178 people (out of total 1632): (1) overallaverage, = a + a, HouseholdIncome, + & Look at the regression output in Table 1 and answer the following questions: a) Comment on the R-squared and Adjusted R-squared displayed in the regression output. How can the value of the R-squared be increased? (5 marks) b) Write down the estimated form of your regression. Carefully interpret the estimated coefficients and comment on their significance. Are they in line with your expectations? Explain why. (5 marks) c) Comment on the F-test. Describe what it measures and what it tells you about your regression model. Do you think you need to adjust the model? If yes, what would you suggest? If no, why not? (5 marks) Table 1: output of regression 1 Overall Average Household Income cons No.of Obs 178 Coefficient F(1,176) 0.92 -9.00-06 4.287 Standard Error 6.72e-06 Prob > F 0.402 0.095 R-squared 0.0104 t value P>It -1.34 45.12 Adi R-Squared -0.0010 0.182 0.000 Root MSE 0.1351
Expert Answer:
Answer rating: 100% (QA)
a The Rsquared and Adjusted Rsquared displayed in the regression output are measures of how well the independent variable Household Income explains the variation in the dependent variable Overall Aver... View the full answer
Related Book For
Essentials of Business Analytics
ISBN: 978-1285187273
1st edition
Authors: Jeffrey Camm, James Cochran, Michael Fry, Jeffrey Ohlmann, David Anderson, Dennis Sweeney, Thomas Williams
Posted Date:
Students also viewed these economics questions
-
Planning is one of the most important management functions in any business. A front office managers first step in planning should involve determine the departments goals. Planning also includes...
-
Identify the process evaluation article that you chose and explain why you selected this example. Describe the purpose of the evaluation, the informants, the questions asked, and the results of the...
-
Solve Prob. 410 using singularity functions. Use statics to determine the reactions. Prob. 410, The figure shows a cantilever consisting of steel angles size 100 Ã 100 Ã 12 mm mounted...
-
The system shown in FIGURE 6-45 consists of two pulleys and two blocks. The pulleys each have a mass of 2.0 kg, the block on the left has a mass of 16 kg, and the block on the right has a mass m. The...
-
Case Development began operations in December 2021. When property is sold on an installment basis, Caserecognizes installment income for financial reporting purposes in the year of the sale. For tax...
-
Suppose the economys labor market is competitive and that labor demand can be written as w = 50 0.3E while labor supply can be written as w = 8 + 0.2E where E is the total amount of employment in...
-
During 2013, Matti Conners, president of Maggert Company, was paid a semimonthly salary of $5,200. Compute the amount of FICA taxes that should be withheld fromher: OASDI HI a. 9th paycheck S b. 22nd...
-
Can Americans trust the results of the 2020 Census? The first results of the 2020 Census were released Monday, after encountering so many obstacles that some census experts privately joked that it...
-
Sadie Cuono started her own consulting firm, Cuono Consulting, on May 1, 2020. The trial balance at May 31 is as follows. In addition to those accounts listed on the trial balance, the chart of...
-
Illinois Tool Works is considering a project that has an initial cash outflow of $1.2 million and expected cash inflows of $326,000 per year for the next 5 years. What is the project's IRR? Your...
-
people who experience ipv should be treated as what of their own situation ?
-
For over forty years, the Capital Asset Pricing Model (CAPM) has been subject to intense scrutiny from academics and practitioners. Do you think CAPM work or not work? Please provide a detailed...
-
You can afford a $1100 per monthly mortgage payment. You've found a 30-year loan at 7% interest. Use the TVM Solver on the TI calculator. Round to the nearest cent (two decimal places). (a) How large...
-
Two lightweight rods 24 cm in length are mounted perpendicular to an axle and at 180 to each other. At the end of each rod is a 480-g mass. The rods are spaced 42 cm apart along the axle. The axle...
-
Who is the intended target audience? 2) What messages in the advertisement are conveyed? 3) What elements of the advertisement are most closely linked to the target audience? 4) If the advertisement...
-
The local baseball team conducts a study to find the amount spent on refreshments at the ballpark. Over the course of the season, they gather simple random samples of 500 men and 1000 women. For men,...
-
r = 0.18 Find the coefficients of determination and non-determination and explain the meaning of each.
-
Refer to the gasoline sales time series data in Table 5.1. a. Compute four-week and five-week moving averages for the time series. b. Compute the MSE for the four-week and five-week moving average...
-
Consider again the scenario described in Problem 4. a. The Center for Business Analytics is considering a refund policy for no-shows. No refund would be given for members who do not attend, but...
-
Refer to the clustering problem involving the file FBS described in Problem 1. Apply hierarchical clustering with 10 clusters using football stadium capacity, latitude, longitude, endowment, and...
-
Describe the equitable parent doctrine and explain how it was applied by the Wisconsin Supreme Court in Ay val.
-
Explain what it means to disestablish paternity. Identify some of the common arguments in favor of and against disestablishment.
-
Identify three circumstances in which assisted reproductive technology is most likely to be utilized as a reproductive option.
Study smarter with the SolutionInn App