

Question: You have been asked to design a sampling plan for a new process. The supervisor of the local area has decided that they will utilize
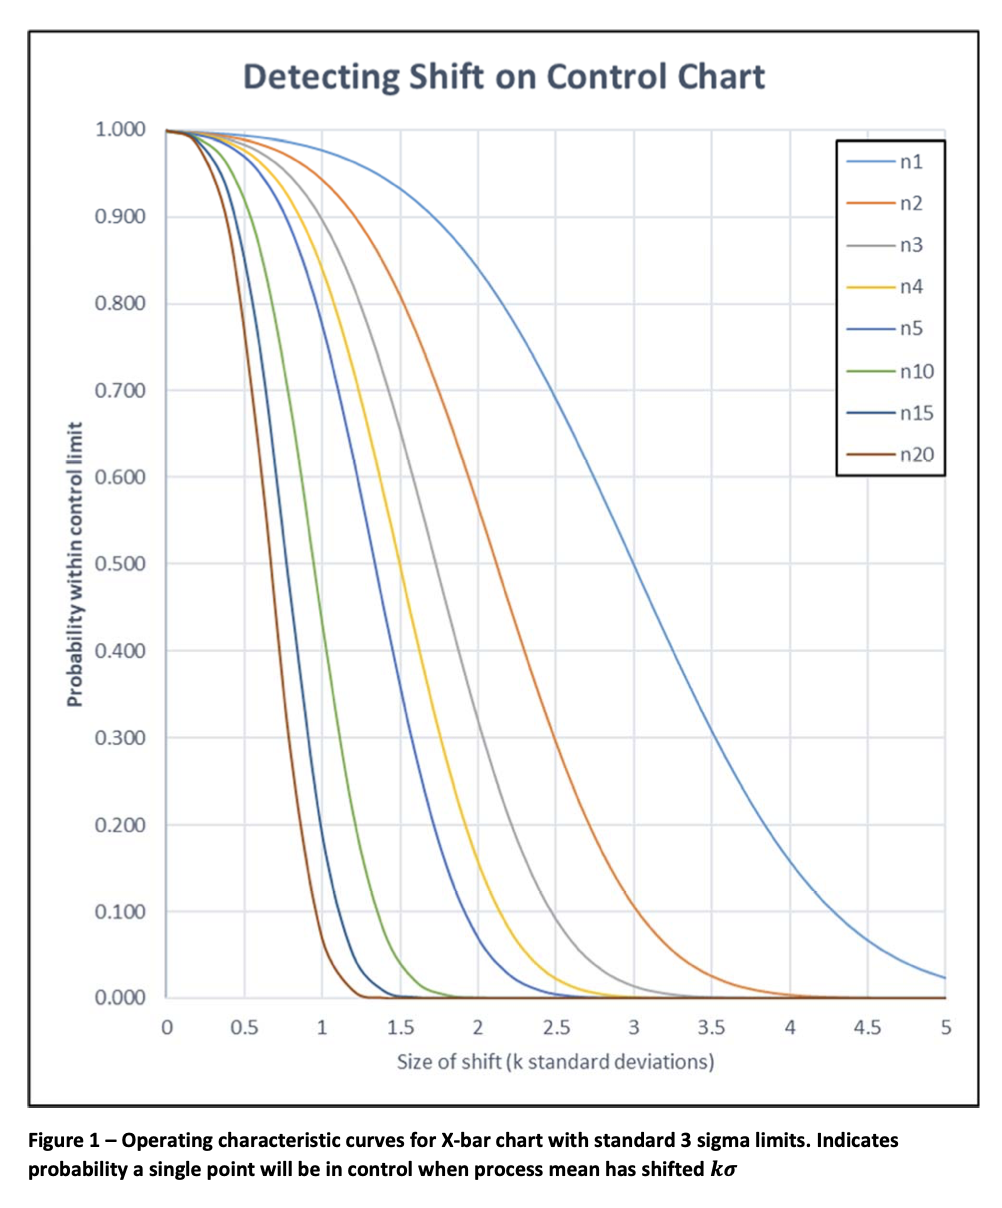
You have been asked to design a sampling plan for a new process. The supervisor of the local area has decided that they will utilize an X-bar/R chart with a sample every 2 hours and they would like you to recommend what sample size (n) they should use. In talking with the supervisor they indicate that the process isnt too critical but they dont want to run too long at an incorrect setting. As an initial choice they determine that theyd like to catch a relatively large shift (1.5) about 20% of the time (p=0.20) giving them an ARL of about 5 samples before they catch the problem.
- Determine (using the OC charts) what n will yield the required p and ARL. (limit your choice of n to one of the ones offered on the table.
- Assume that their process has a mean of 200 and a standard deviation of 12. Calculate the lower control limit (LCL), the center line (CL), and the upper control limit (UCL) using your suggested sample size.
- Assume that the mean shifts to 182 (a 1.5 shift). Using the control limits on your chart, what is the probability that you will see an out-of-control point?
- On average how many would you have to take to realize there is a problem?
- Do your answers in (c) and (d) above give you the desired p and ARL?
Step by Step Solution
There are 3 Steps involved in it
1 Expert Approved Answer
Step: 1 Unlock

Question Has Been Solved by an Expert!
Get step-by-step solutions from verified subject matter experts
Step: 2 Unlock
Step: 3 Unlock