

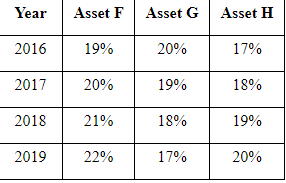
Question: You have been given the expected return data shown in the first table on three assetsF, G, and Hover the period 2016-2019: Using these assets,
You have been given the expected return data shown in the first table on three assetsF, G, and Hover the period 2016-2019:
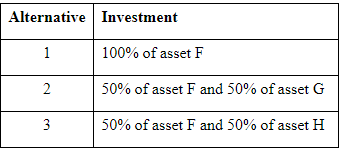
Using these assets, you have isolated the three investment alternatives shown in the following table:
a.The expected return over the 4-year period for alternative 1 is ....... %. (Round to two decimal place.)
The expected return over the 4-year period for alternative 2 is ................. %. (Round to two decimal place.)
The expected return over the 4-year period for alternative 3 is ................... %. (Round to two decimal place.)
b.The standard deviation of returns over the 4-year period for alternative 1 is ............%. (Round to two decimal places.)
The standard deviation of returns over the 4-year period for alternative 2 is .................. %. (Round to two decimal places.)
The standard deviation of returns over the 4-year period for alternative 3 is ............ %. (Round to two decimal places.)
c.The coefficient of variation for alternative 1 is .......................... . (Round to three decimal places.)
The coefficient of variation for alternative 2 is ......................... . (Round to three decimal places.)
The coefficient of variation for alternative 3 is .......................... . (Round to three decimal places.)
d.On the basis of your findings, Alternative .................... is the best choice.
Year Asset F Asset G Asset H 2016 19% 20% 17% 2017 20% 19% 18% 2018 21% 18% 19% 2019 22% 17% 20% Alternative Investment 1 100% of asset F 2 50% of asset F and 50% of asset G 3 50% of asset F and 50% of asset H
Step by Step Solution
There are 3 Steps involved in it

Get step-by-step solutions from verified subject matter experts