

Question: You have been given the Table below on the existing housing stock for England as a whole and broken down by region. Answer the questions
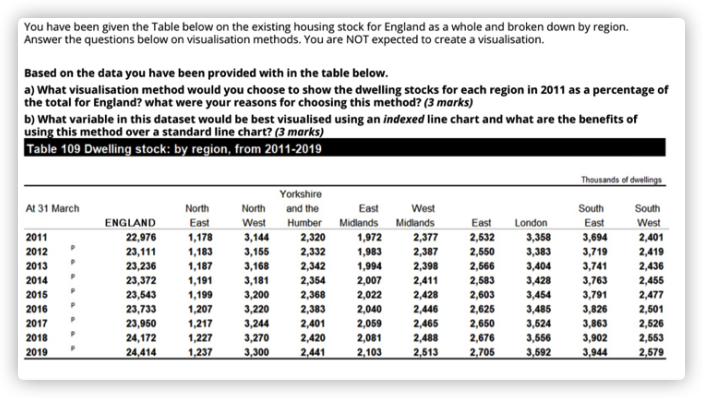
You have been given the Table below on the existing housing stock for England as a whole and broken down by region. Answer the questions below on visualisation methods. You are NOT expected to create a visualisation. Based on the data you have been provided with in the table below. a) What visualisation method would you choose to show the dwelling stocks for each region in 2011 as a percentage of the total for England? what were your reasons for choosing this method? (3 marks) b) What variable in this dataset would be best visualised using an indexed line chart and what are the benefits of using this method over a standard line chart? (3 marks) Table 109 Dwelling stock: by region, from 2011-2019 Thousands of dwellings Yorkshire At 31 March North North and the East West South South ENGLAND East West Humber Midlands Midlands East London East West 2011 22,976 1,178 3,144 2,320 1,972 2,377 2,532 3,358 3,694 2012 2,401 23,111 1,183 3.155 2,332 1.983 2,387 2,550 3,383 3,719 2013 2,419 23,236 1,187 3,168 2,342 1,994 2,398 2,566 3.404 3,741 2014 2,436 23,372 1,191 3,181 2,354 2.007 2,411 2.583 3.428 3,763 2015 2,456 23,543 1,199 3,200 2,368 2.022 2,428 2,603 3.454 2016 3,791 2.477 23,733 1,207 3,220 2,383 2.040 2,446 2,625 3.485 3,826 2017 2,501 23,950 1,217 3,244 2,401 2.059 2,465 2,650 3,524 3,863 2018 2,526 24,172 1.227 3,270 2,420 2,081 2.488 2,676 3,556 3.902 2019 2.553 24,414 1,237 3,300 2,441 2,103 2,513 2,705 3,592 3.944 2,579
Step by Step Solution
There are 3 Steps involved in it

Get step-by-step solutions from verified subject matter experts