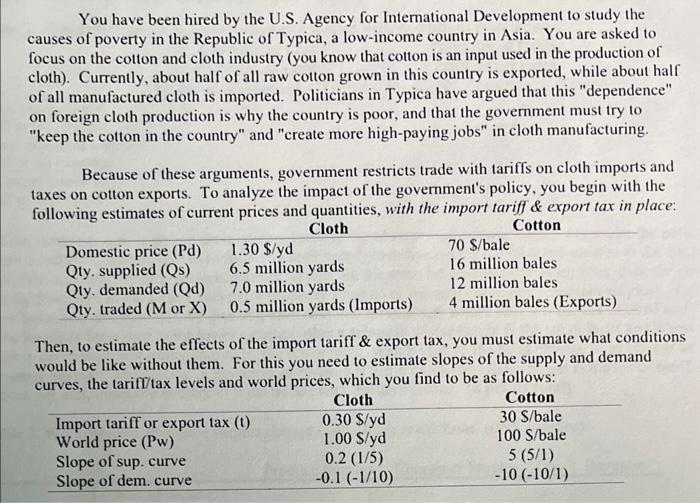
You have been hired by the U.S. Agency for International Development to study the causes of...
Fantastic news! We've Found the answer you've been seeking!
Question:
Transcribed Image Text:
You have been hired by the U.S. Agency for International Development to study the causes of poverty in the Republic of Typica, a low-income country in Asia. You are asked to focus on the cotton and cloth industry (you know that cotton is an input used in the production of cloth). Currently, about half of all raw cotton grown in this country is exported, while about half of all manufactured cloth is imported. Politicians in Typica have argued that this "dependence" on foreign cloth production is why the country is poor, and that the government must try to "keep the cotton in the country" and "create more high-paying jobs" in cloth manufacturing. Because of these arguments, government restricts trade with tariffs on cloth imports and taxes on cotton exports. To analyze the impact of the government's policy, you begin with the following estimates of current prices and quantities, with the import tariff & export tax in place: Cloth Cotton Domestic price (Pd) Qty, supplied (Qs) Qty. demanded (Qd) Qty. traded (M or X) 1.30 $/yd 6.5 million yards 7.0 million yards 0.5 million yards (Imports) Then, to estimate the effects of the import tariff & export tax, you must estimate what conditions would be like without them. For this you need to estimate slopes of the supply and demand curves, the tariff/tax levels and world prices, which you find to be as follows: Cloth Cotton 30 S/bale 100 S/bale 5 (5/1) -10 (-10/1) Import tariff or export tax (1) World price (Pw) Slope of sup. curve Slope of dem. curve 70 $/bale 16 million bales. 12 million bales 4 million bales (Exports) 0.30 S/yd 1.00 S/yd 0.2 (1/5) -0.1 (-1/10) Price Cloth 1.5 s/yd 1.4 1.3 1.2 1.1 1 0.9 0.8 0 (1) You use this information to draw supply-demand diagrams for each market on the graphs below. 1) Draw two lines (1 with & 1 without tariff/tax) from the price axis to the S&D curves already drawn for each market. 2) Draw circles around the points on each supply and demand curve which you now observe, and 3) then draw squares around the points you would observe without the government's tariff or tax. The Market for Cloth in Typica 2 345 7 8 Qty. of Cloth (million yards) 9 10 11 Price Cto S/yd 110 100 90 80 70 60 50 02 The Market for Cotton in Typica 46 8 10 12 14 16 18 20 22 24 Qty. of Cotton (million bales) You have been hired by the U.S. Agency for International Development to study the causes of poverty in the Republic of Typica, a low-income country in Asia. You are asked to focus on the cotton and cloth industry (you know that cotton is an input used in the production of cloth). Currently, about half of all raw cotton grown in this country is exported, while about half of all manufactured cloth is imported. Politicians in Typica have argued that this "dependence" on foreign cloth production is why the country is poor, and that the government must try to "keep the cotton in the country" and "create more high-paying jobs" in cloth manufacturing. Because of these arguments, government restricts trade with tariffs on cloth imports and taxes on cotton exports. To analyze the impact of the government's policy, you begin with the following estimates of current prices and quantities, with the import tariff & export tax in place: Cloth Cotton Domestic price (Pd) Qty, supplied (Qs) Qty. demanded (Qd) Qty. traded (M or X) 1.30 $/yd 6.5 million yards 7.0 million yards 0.5 million yards (Imports) Then, to estimate the effects of the import tariff & export tax, you must estimate what conditions would be like without them. For this you need to estimate slopes of the supply and demand curves, the tariff/tax levels and world prices, which you find to be as follows: Cloth Cotton 30 S/bale 100 S/bale 5 (5/1) -10 (-10/1) Import tariff or export tax (1) World price (Pw) Slope of sup. curve Slope of dem. curve 70 $/bale 16 million bales. 12 million bales 4 million bales (Exports) 0.30 S/yd 1.00 S/yd 0.2 (1/5) -0.1 (-1/10) Price Cloth 1.5 s/yd 1.4 1.3 1.2 1.1 1 0.9 0.8 0 (1) You use this information to draw supply-demand diagrams for each market on the graphs below. 1) Draw two lines (1 with & 1 without tariff/tax) from the price axis to the S&D curves already drawn for each market. 2) Draw circles around the points on each supply and demand curve which you now observe, and 3) then draw squares around the points you would observe without the government's tariff or tax. The Market for Cloth in Typica 2 345 7 8 Qty. of Cloth (million yards) 9 10 11 Price Cto S/yd 110 100 90 80 70 60 50 02 The Market for Cotton in Typica 46 8 10 12 14 16 18 20 22 24 Qty. of Cotton (million bales)
Expert Answer:
Answer rating: 100% (QA)
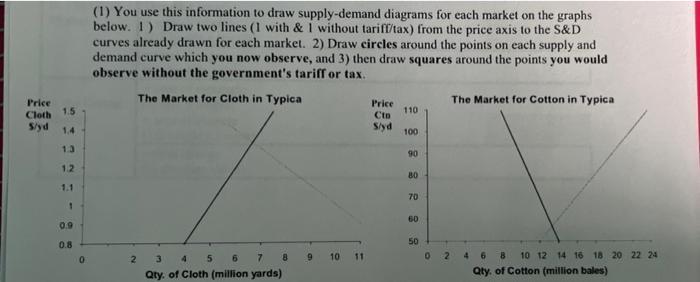
The Market for Cloth in Typica Price Cloth 15 Syd 14 13 12 11 1 09 80 08 2 3 4 5 6 Qty of Cloth million yards 8 9 10 Without the tarifftax the equilibrium price of cloth would be 080yd and the equilib... View the full answer
Related Book For
Statistics For Business And Economics
ISBN: 9780132745659
8th Edition
Authors: Paul Newbold, William Carlson, Betty Thorne
Posted Date:
Students also viewed these finance questions
-
You have been hired by the No Flight Golf Company, and your first task is to decide whether to market a new golf ball utilizing breakthrough technology and, if so, determine the price. The payoff of...
-
You have been hired by Southwest Airlines. Your primary task is to keep the Airfares low and the company profitable. In the prior years, Southwest has extensively bought forward contracts of barrels...
-
You have been hired by a regional supermarket chain as the candy and snack buyer. Your shelves are dominated by national firms, like Wrigley's and Nabisco. The chain imposes a substantial slotting...
-
1) Identify the population and sample from the following statements: a) A survey conducted at NSU has found that out of 371 students, 52 are left-handed b) In a rescue shelter, the height and weight...
-
Distinguish between a reporting study and a descriptive study.
-
Discuss the reasons a company would use a predetermined overhead rate rather than actual overhead to determine cost of products or services.
-
In February 2014, defendant Ibrahim M. Shihadeh, d/b/a Creative Designs Kitchen and Baths, agreed to purchase 25% of his anticipated natural gas needs at a fixed price for the 201415 and 201516...
-
The issue had come up again and again in various management meetings and company seminars. Novartis had too many products and needed to reduce the product proliferation that had occurred. Thomas...
-
The N excess/deficit factor for 100 kg of an organic material that contained 60% C (carbon) and 0.5% N (nitrogen) would likely be (assuming that 35% of the carbon is metabolized by microorganisms and...
-
Kansas Corp., an American company, has a payment of 5 million due to Tuscany Corp. one year from today. At the prevailing spot rate of 0.90 /$, this would cost Kansas $5,555,556, but Kansas faces the...
-
Hanoi Company provides for Doubtful Account based on 2.5% of gross Account Receivable. The following data is available for 2020 Credit sales during 2020 $4,500,000 Account Receivable 1,200,000...
-
Complete the table below: Q TVC TFC Price 1 2 10 60 20 18 60 20 TC TR MC MR Profits
-
Costs of production are determined: a. only by the input prices that are available. b. by the technologies that are available and by the demand for the output. c. by the technologies that are...
-
Select the CORRECT decimal-to-binary conversion O 73=1000110 O 152-1001100 O 88=1011000>> O 233=11101011
-
Determine whether each of the following scenarios would be studied in microeconomics or macroeconomics. Economic Scenarios (8 items) (Drag and drop into the appropriate area below) How a cut in...
-
What was the contract that legitimized a divine ruler's reign if proven they were worthy? the Taoist Seal the Mandate of Heaven the Legalist Mandate the Feudal Lands Policy
-
The savings account began with a deposit of $140 three years ago. If the savings account now has 16.6% more in the account, what is the balance in the account? Report your answer to two decimal...
-
Give the structural formulas of the alkenes that, on ozonolysis, give: a. (CH3)2C=O and CH2=O b. Only (CH3CH2)2C=O c. CH3CH=O and CH3CH2CH=O d. O=CHCH2CH2CH2CH=O
-
A large consumer goods company has been studying the effect of advertising on total profits. As part of this study, data on advertising expenditures and total sales were collected for a five-month...
-
Prairie Flower Cereal, Inc., is a small but growing producer of hot and ready-to-eat breakfast cereals. The company was started in 1910 by Gordon Thorson, a successful grain farmer. You have been...
-
In Example 1.6 we plotted the USD to 1 EUR for a 6-month time period. a. Use a time-series plot to graphically display the currency conversion from the EUR to 1 USD. The data are contained in the...
-
Consider the following time series data. a. Construct a time series plot. What type of pattern exists in the data? b. Show the four-quarter and centered moving average values for this time series. c....
-
The following table reports prices and usage quantities for two items in 2009 and 2011. a. Compute price relatives for each item in 2011 using 2009 as the base period. b. Compute an unweighted...
-
Refer to exercise 35. a. Deseasonalize the time series using the adjusted seasonal indexes computed in part (c) of exercise 35. b. Using Minitab or Excel, compute the linear trend regression equation...
Study smarter with the SolutionInn App