

Question: You have been provided with the original data and two regression models with their corresponding outputs. a) In order to compare the two regression
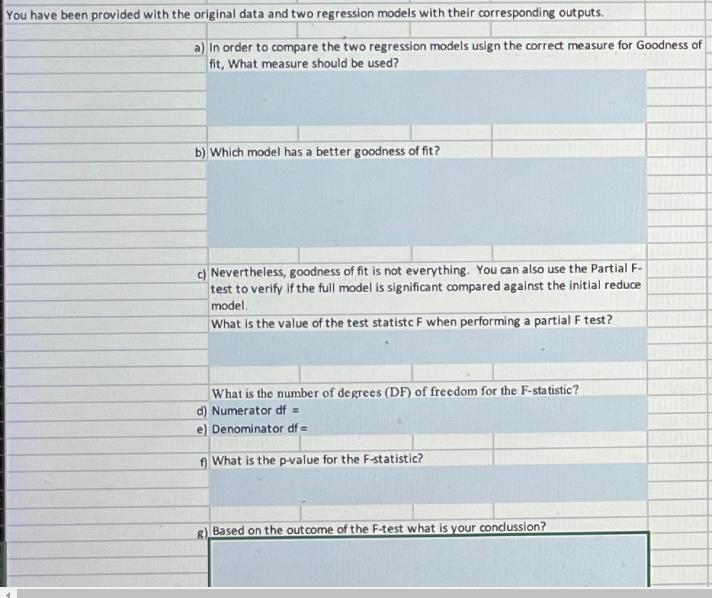
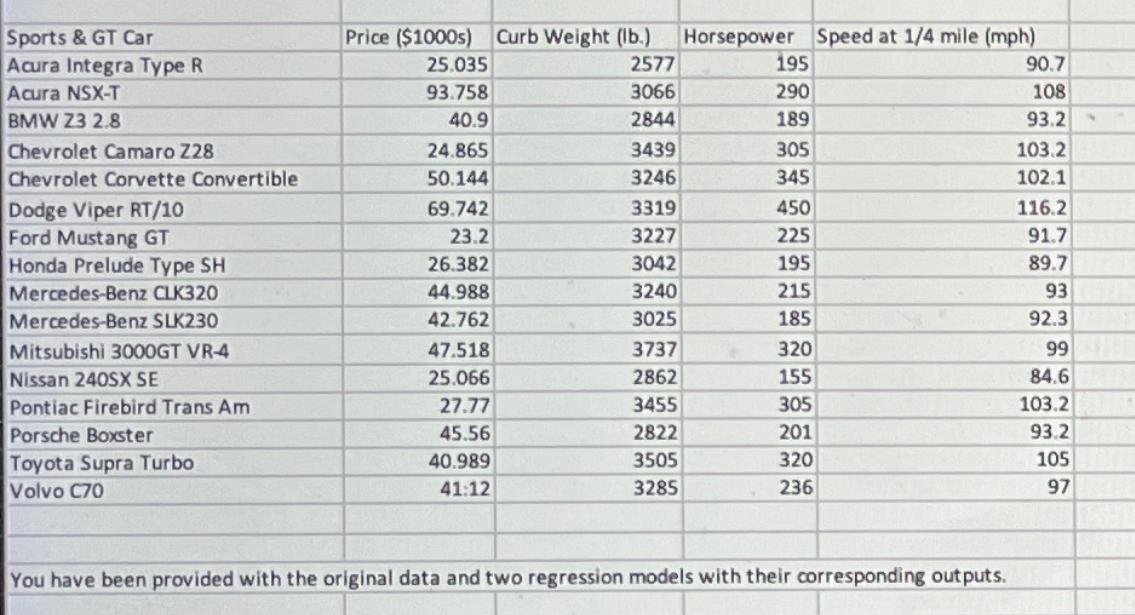
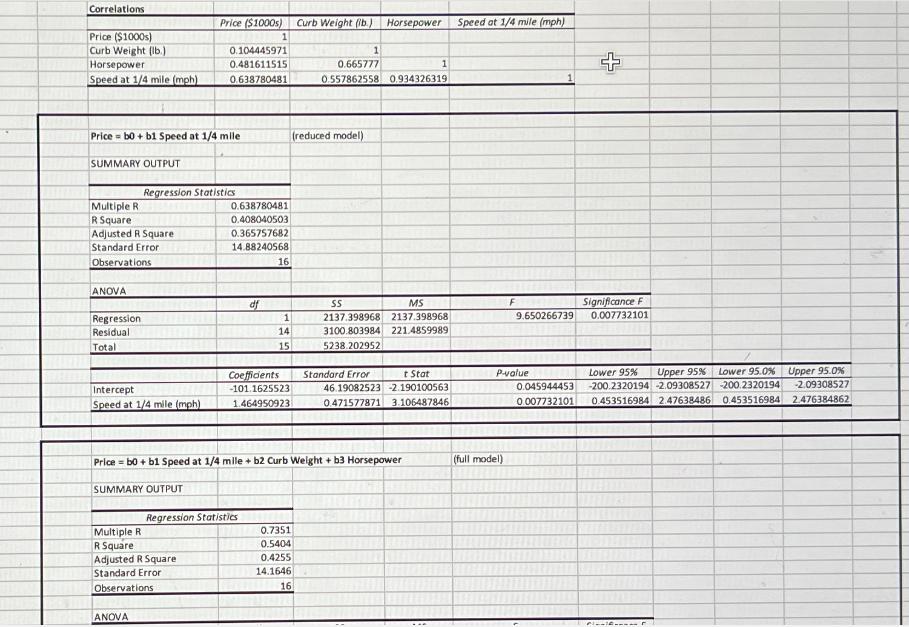
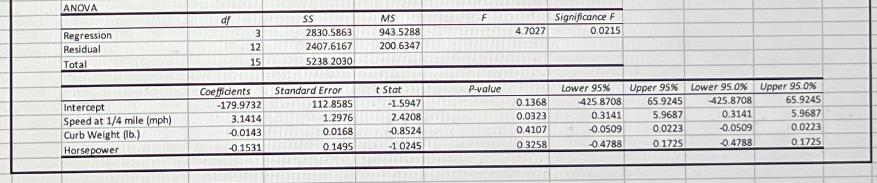
You have been provided with the original data and two regression models with their corresponding outputs. a) In order to compare the two regression models usign the correct measure for Goodness of fit, What measure should be used? b) Which model has a better goodness of fit? c) Nevertheless, goodness of fit is not everything. You can also use the Partial F- test to verify if the full model is significant compared against the initial reduce model. What is the value of the test statistc F when performing a partial F test? What is the number of degrees (DF) of freedom for the F-statistic? d) Numerator df = e) Denominator df= f) What is the p-value for the F-statistic? R) Based on the outcome of the F-test what is your concussion? Sports & GT Car Acura Integra Type R Acura NSX-T BMW Z3 2.8 Price ($1000s) Curb Weight (lb.) Horsepower Speed at 1/4 mile (mph) 25.035 2577 195 90.7 93.758 3066 290 108 40.9 2844 189 93.2 Chevrolet Camaro Z28 24.865 3439 305 103.2 Chevrolet Corvette Convertible 50.144 3246 345 102.1 Dodge Viper RT/10 69.742 3319 450 116.2 Ford Mustang GT 23.2 3227 225 91.7 Honda Prelude Type SH 26.382 3042 195 89.7 Mercedes-Benz CLK320 44.988 3240 215 93 Mercedes-Benz SLK230 42.762 3025 185 92.3 Mitsubishi 3000GT VR-4 47.518 3737 320 99 2 Nissan 240SX SE 25.066 2862 155 84.6 Pontiac Firebird Trans Am 27.77 3455 305 103.2 Porsche Boxster 45.56 2822 201 93.2 Toyota Supra Turbo 40.989 3505 320 105 Volvo C70 41:12 3285 236 97 You have been provided with the original data and two regression models with their corresponding outputs. Correlations Price ($1000s) Curb Weight (lb.) Horsepower Price ($1000s) Curb Weight (lb.) Horsepower 1 0.104445971 1 0.481611515 Speed at 1/4 mile (mph) 0.638780481 0.665777 0.557862558 1 0.934326319 Speed at 1/4 mile (mph) Price=b0+ b1 Speed at 1/4 mile (reduced model) SUMMARY OUTPUT Regression Statistics Multiple R 0.638780481 R Square 0.408040503 Adjusted R Square 0.365757682 Standard Error Observations 14.88240568 16 + ANOVA df SS MS F Regression 1 Residual 14 Total 15 2137.398968 2137.398968 3100.803984 221.4859989 5238.202952 9.650266739 Significance F 0.007732101 Coefficients Intercept Speed at 1/4 mile (mph) -101.1625523 1.464950923 Standard Error t Stat 46.19082523 -2.190100563 0.471577871 3.106487846 P-value 0.045944453 0.007732101 Lower 95% Upper 95% Lower 95.0% Upper 95.0% -200.2320194 -2.09308527 -200.2320194 0.453516984 2.47638486 0.453516984 -2.09308527 2.476384862 Price b0+b1 Speed at 1/4 mile + b2 Curb Weight + b3 Horsepower (full model) SUMMARY OUTPUT Regression Statistics Multiple R 0.7351 R Square 0.5404 Adjusted R Square 0.4255 Standard Error 14.1646 Observations 16 ANOVA ANOVA df SS MS Regression 3 2830.5863 Residual Total 12 2407.6167 943.5288 200.6347 Significance F 4.7027 0.0215 15 5238 2030 Coefficients Standard Error t Stat P-value Lower 95% Upper 95% Lower 95.0% Upper 95.0% Intercept Speed at 1/4 mile (mph) -179.9732 3.1414 112.8585 -1.5947 0.1368 -425.8708 65.9245 -425.8708 65.9245 1.2976 2.4208 0.0323 0.3141 5.9687 0.3141 5.9687 Curb Weight (lb.) -0.0143 0.0168 -0.8524 0.4107 -0.0509 0.0223 -0.0509 0.0223 Horsepower -0.1531 0.1495 -1.0245 0.3258 -0.4788 0.1725 -0.4788 0.1725
Step by Step Solution
There are 3 Steps involved in it

Get step-by-step solutions from verified subject matter experts