

Question: You have been tasked with creating a web page that displays the average temperatures for Delaware for each month for 1950 - 2018 and then
You have been tasked with creating a web page that displays the average temperatures for Delaware for each month for 1950 - 2018 and then comparing it to 2018's temperature data.
The averages for 1950 - 2018 are as follows:
Jan 33.6 Feb 35.6 Mar 43.1 Apr 53.2 May 62.7 Jun 71.5 Jul 76.3 Aug 74.6 Sep 68 Oct 57 Nov 46.7 Dec 37.7
The averages for 2018 are as follows:
Jan 32.6 Feb 42.9 Mar 40.3 Apr 51.4 May 68.1 Jun 72.5 Jul 77.1 Aug 78.6 Sep 73.2 Oct 60.1 Nov 45.3 Dec 41.0
Create a script that generates webpage with the temperature data:
- The data should be stored in arrays
- Each month should be listed with the two temperatures and the difference between the two.
- If there is a variation of more than 2 degrees then the difference should be highlighted with green font for less than the average or red font for greater than the average.
- Total the averages for each data set and do a final compare of the difference between the two.
- You should use a loop to process the data.
Sample Output:
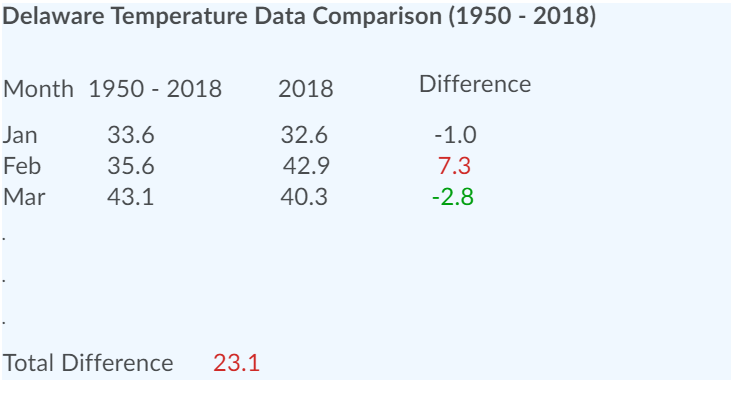
Delaware Temperature Data Comparison (1950 - 2018) Month 1950 - 2018 2018 Difference Jan Feb Mar 33.6 35.6 43.1 32.6 42.9 40.3 -1.0 7.3 -2.8 Total Difference 23.1
Step by Step Solution
There are 3 Steps involved in it

Get step-by-step solutions from verified subject matter experts