

Question: -You have completed this earned value chart, which shows your project's planned value (PV), earned value (EV), and actual cost (AC). What does this chart
-You have completed this earned value chart, which shows your project's planned value (PV), earned value (EV), and actual cost (AC). What does this chart tell you about your project?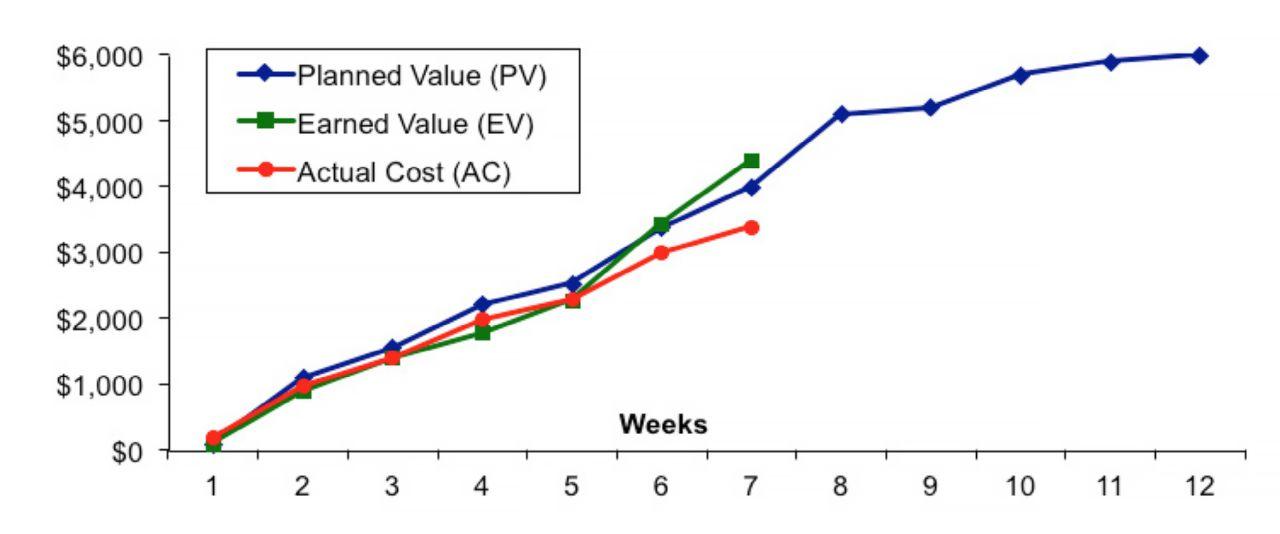
Select an answer:
a-It is under budget and behind schedule.
b-It is over budget and on schedule.
c-It is over budget and ahead of schedule.
d-It is under budget and ahead of schedule.
-You have three estimates for an activity in a project budget, as shown in this table. Using the beta distribution method, how would you calculate your estimate for the hours
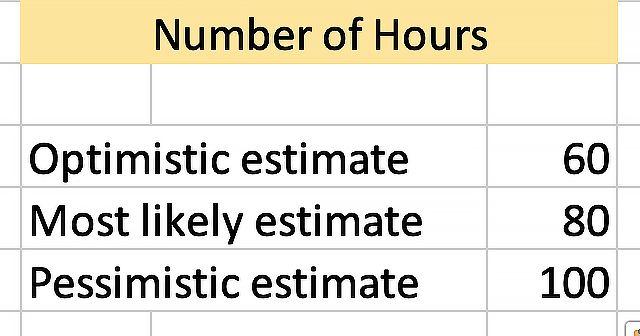
Select an answer:
a-100 - 80 + 60
b-[(60 x 2) + 80 + (100 x 20)] divided by 5
c-(60 + 80 + 100) divided by 3
d-[60 + (4 x 80) + 100] divided by 6
Number of Hours \begin{tabular}{|l|r|} \hline Optimistic estimate & 60 \\ \hline Most likely estimate & 80 \\ \hline Pessimistic estimate & 100 \\ \hline \end{tabular}Step by Step Solution
There are 3 Steps involved in it

Get step-by-step solutions from verified subject matter experts