

You have data on the Purchasing Power of the US dollar from 1950 to 2005. The data
Question:
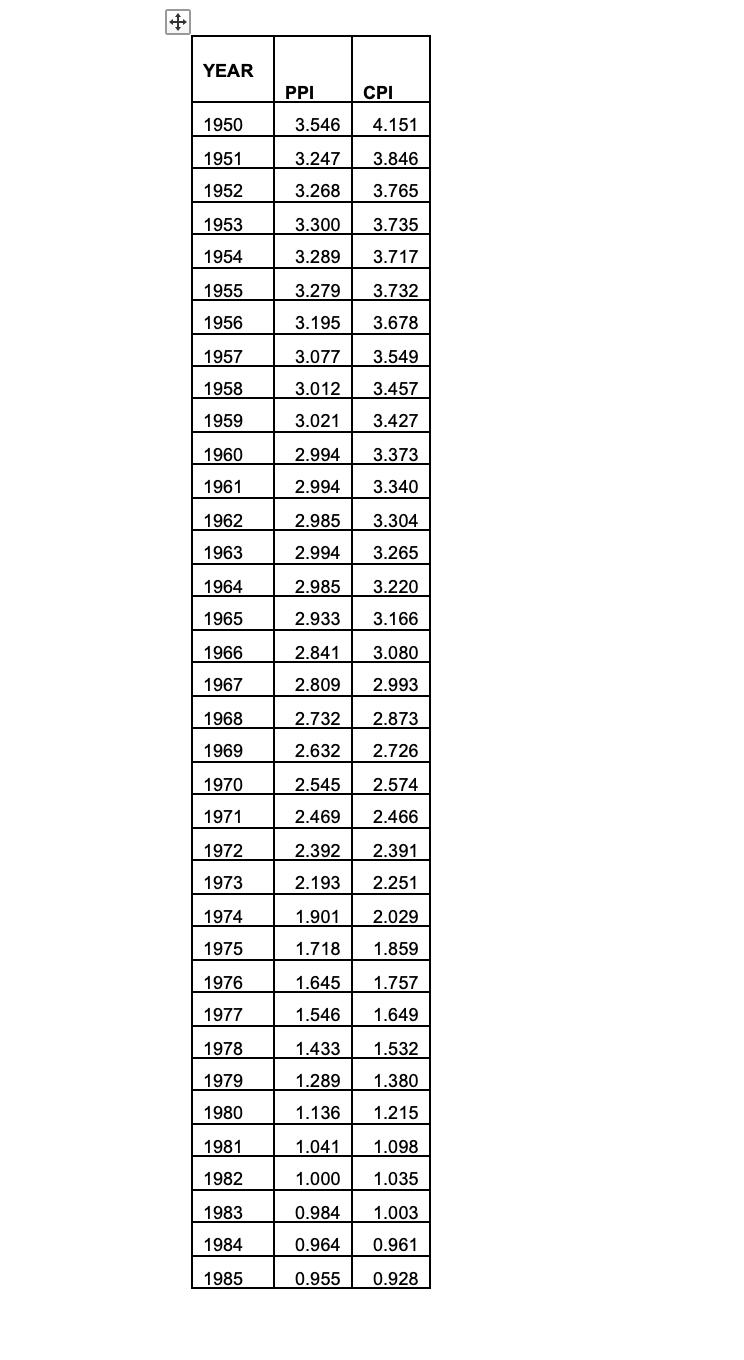
You have data on the Purchasing Power of the US dollar from 1950 to 2005. The data is in the Excel file (US_PRICE_INDEX) Use the data to recalculate the actual relative prices (PPI and CPI) between 1950 and 2005. The PPL is the Reciprocal of the Purchasing Power Index. The CPI is the Reciprocal of the CPI, beginning in 1950. Create two new columns called the CPI and the PPI. The CPI in 1950 should be 100 or 1.00. The PPI in 1950 should be 100 or 1.00 calculated as B2/$B$2, for example,
a. Prepare a new Table showing the Calculated Price Indexes (Attach as Appendix I to our report)
b. Plot the chart of PPI and CPI and explain the relative trends in the two price indices.
c. Which Index has risen faster and since what year did one diverge significantly from the other?
d. Which index has a rising trend? Which index has a declining trend? Alternatively, are the two indexes moving in the same direction? Explain.
Expert Answer:


International Financial Management
ISBN: 978-0132162760
2nd edition
Authors: Geert Bekaert, Robert J. Hodrick
