

Question: You have the data shown below. Complete parts a through d. a. Construct a frequency distribution for these data. Use the 2 2 n guideline
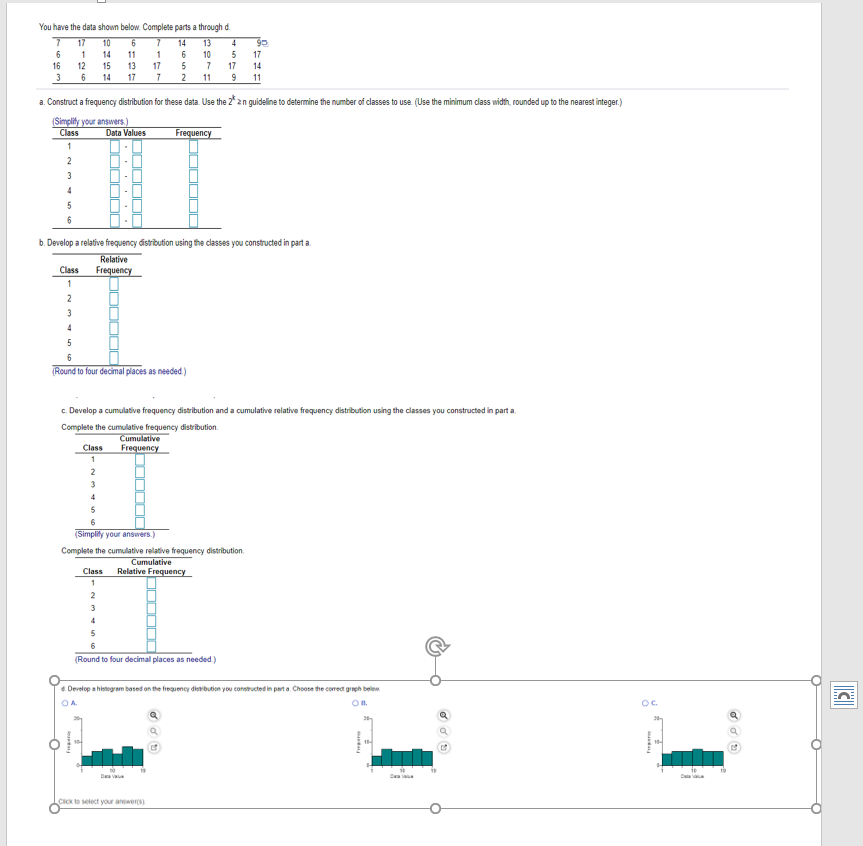
You have the data shown below. Complete parts a through d. a. Construct a frequency distribution for these data. Use the 2" 2 n guideline to determ number of classes to use (Use the minimum class width, rounded up to the nearest integer.) (Simplify your answers.) Class Data Values Frequency b. Develop a relative frequency distribution using the classes you constructed in part a. Relative Class Frequency (Round to four decimal places as needed ) c. Develop a cumulative frequency distribution and a cumulative relative frequency distribution using the classes you constructed in part a. Complete the curmulative frequency distribution. Cumulative Class Frequency Simplify your answers.) Complete the cumulative relative frequency distribution. Cumulative Class Relative Frequency Round to four decimal places as needed.) Develop a histogram based on the frequency dist bution you constructed in put a. Choose the correct girgh beiem OA OC Fick to select your amriwergin O
Step by Step Solution
There are 3 Steps involved in it

Get step-by-step solutions from verified subject matter experts