

Question: You may need the table to answer question 37 37. Historical Returns. Suppose your great-great-grandfather invested $300 at the end of 1900 in each of
You may need the table to answer question 37
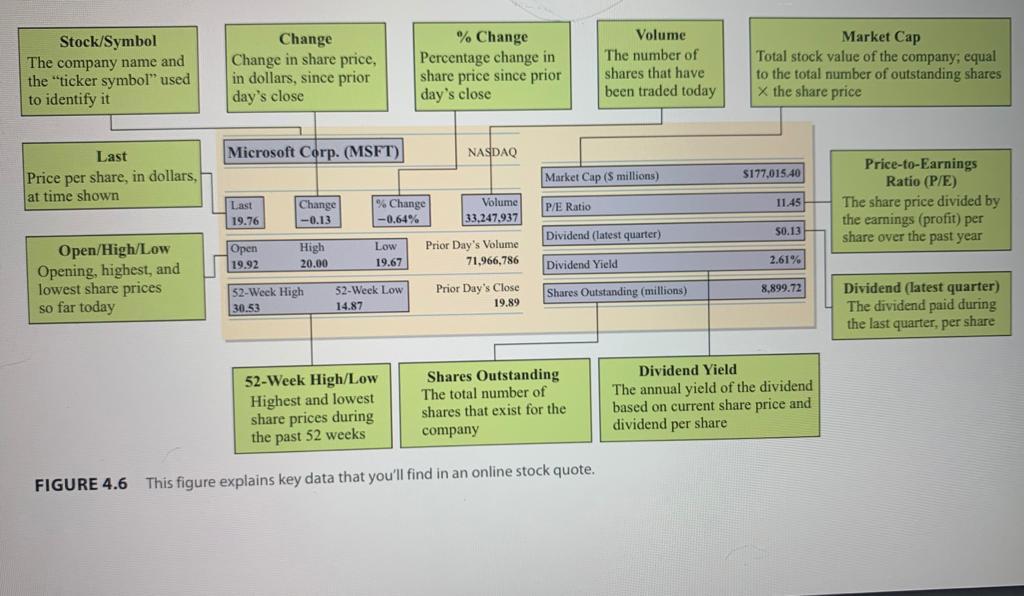
37. Historical Returns. Suppose your great-great-grandfather invested $300 at the end of 1900 in each of three funds that tracked the averages of stocks, bonds, and cash, respectively. Assuming that his investments grew at the rates given in Table 4.6, approximately how much would each investment have been worth at the end of 2012? Stock/Symbol The company name and the "ticker symbol" used to identify it Change Change in share price, in dollars, since prior day's close % Change Percentage change in share price since prior day's close Volume The number of shares that have been traded today Market Cap Total stock value of the company; equal to the total number of outstanding shares x the share price Microsoft Corp. (MSFT) NASDAQ Last Price per share, in dollars, at time shown Market Cap (5 millions) $177,015.40 11.45 Last 19.76 Change -0.13 % Change -0.64% P/E Ratio Volume 33.247,937 Price-to-Earnings Ratio (P/E) The share price divided by the earnings (profit) per share over the past year Dividend (latest quarter) 50.13 Open 19.92 High 20.00 Low 19.67 Prior Day's Volume 71,966,786 2.61% Dividend Yield Open/High/Low Opening, highest, and lowest share prices so far today 8,899.72 52-Week High 30.53 52-Week Low 14.87 Shares Outstanding (millions) Prior Day's Close 19.89 Dividend (latest quarter) The dividend paid during the last quarter, per share 52-Week High/Low Highest and lowest share prices during the past 52 weeks Shares Outstanding The total number of shares that exist for the company Dividend Yield The annual yield of the dividend based on current share price and dividend per share FIGURE 4.6 This figure explains key data that you'll find in an online stock quote. 37. Historical Returns. Suppose your great-great-grandfather invested $300 at the end of 1900 in each of three funds that tracked the averages of stocks, bonds, and cash, respectively. Assuming that his investments grew at the rates given in Table 4.6, approximately how much would each investment have been worth at the end of 2012? Stock/Symbol The company name and the "ticker symbol" used to identify it Change Change in share price, in dollars, since prior day's close % Change Percentage change in share price since prior day's close Volume The number of shares that have been traded today Market Cap Total stock value of the company; equal to the total number of outstanding shares x the share price Microsoft Corp. (MSFT) NASDAQ Last Price per share, in dollars, at time shown Market Cap (5 millions) $177,015.40 11.45 Last 19.76 Change -0.13 % Change -0.64% P/E Ratio Volume 33.247,937 Price-to-Earnings Ratio (P/E) The share price divided by the earnings (profit) per share over the past year Dividend (latest quarter) 50.13 Open 19.92 High 20.00 Low 19.67 Prior Day's Volume 71,966,786 2.61% Dividend Yield Open/High/Low Opening, highest, and lowest share prices so far today 8,899.72 52-Week High 30.53 52-Week Low 14.87 Shares Outstanding (millions) Prior Day's Close 19.89 Dividend (latest quarter) The dividend paid during the last quarter, per share 52-Week High/Low Highest and lowest share prices during the past 52 weeks Shares Outstanding The total number of shares that exist for the company Dividend Yield The annual yield of the dividend based on current share price and dividend per share FIGURE 4.6 This figure explains key data that you'll find in an online stock quote
Step by Step Solution
There are 3 Steps involved in it

Get step-by-step solutions from verified subject matter experts