

Question: You may need to use the appropriate appendix table or technology to answer this question. A consumer product testing organization uses a survey of readers
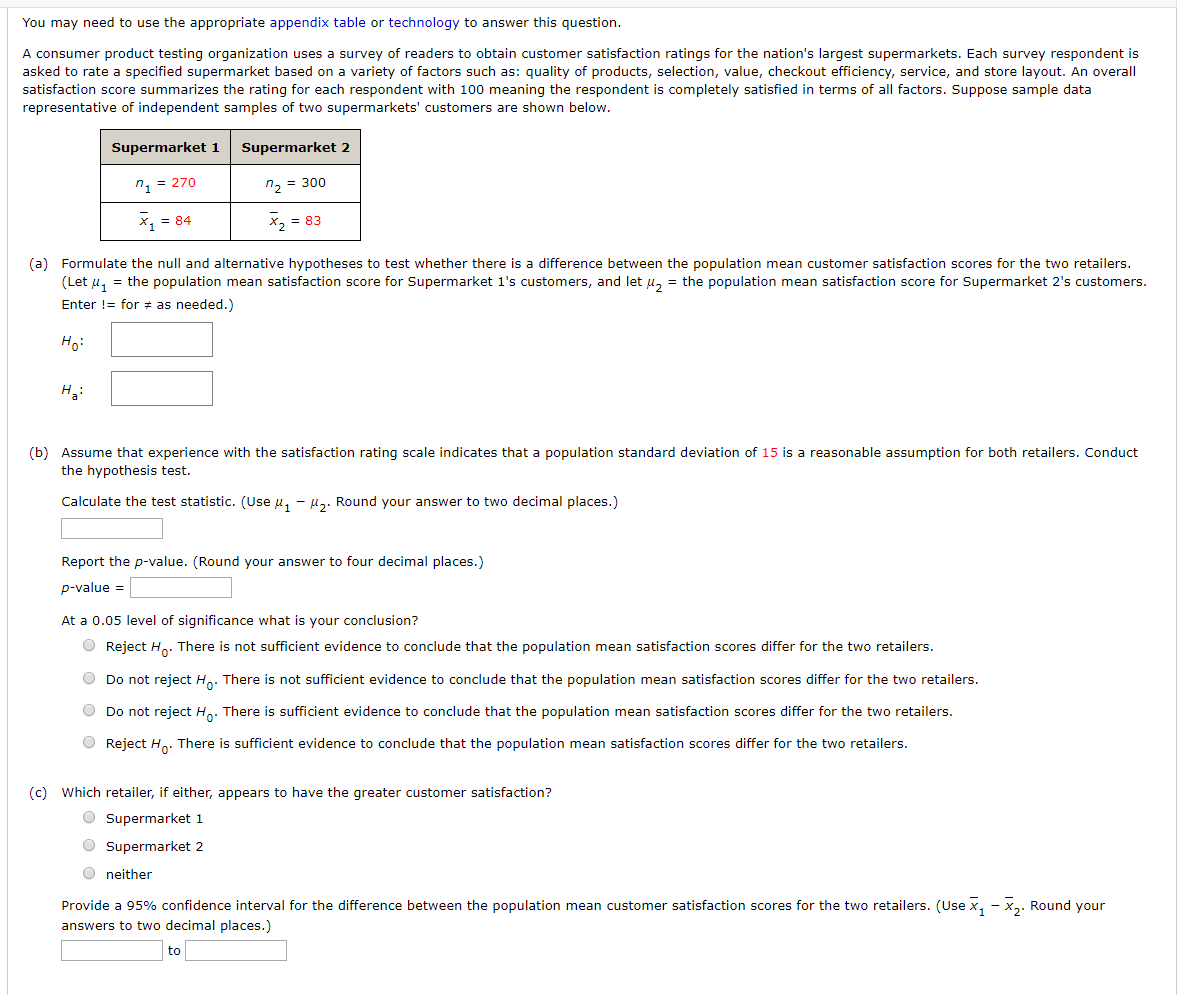
You may need to use the appropriate appendix table or technology to answer this question. A consumer product testing organization uses a survey of readers to obtain customer satisfaction ratings for the nation's largest supermarkets. Each survey respondent is asked to rate a specified supermarket based on a variety of factors such as: quality of products, selection, value, checkout efficiency, service, and store layout. An overall satisfaction score summarizes the rating for each respondent with 100 meaning the respondent is completely satisfied in terms of all factors. Suppose sample data representative of independent samples of two supermarkets' customers are shown below. Supermarket 1 Supermarket 2 n = 270 | n = 300 = 84 Ta = 83 (a) Formulate the null and alternative hypotheses to test whether there is a difference between the population mean customer satisfaction scores for the two retailers. (Let u, = the population mean satisfaction score for Supermarket 1's customers, and let uy = the population mean satisfaction score for Supermarket 2's customers. Enter != for as needed.) Ho: (b) Assume that experience with the satisfaction rating scale indicates that a population standard deviation of 15 is a reasonable assumption for both retailers. Conduct the hypothesis test. Calculate the test statistic. (Use u, - uz. Round your answer to two decimal places.) Report the p-value. (Round your answer to four decimal places.) p-value = At a 0.05 level of significance what is your conclusion? Reject Ho. There is not sufficient evidence to conclude that the population mean satisfaction scores differ for the two retailers. Do not reject Ho. There is not sufficient evidence to conclude that the population mean satisfaction scores differ for the two retailers. Do not reject Ho. There is sufficient evidence to conclude that the population mean satisfaction scores differ for the two retailers. Reject H. There is sufficient evidence to conclude that the population mean satisfaction scores differ for the two retailers. (c) which retailer, if either, appears to have the greater customer satisfaction? Supermarket 1 O Supermarket 2 O neither Provide a 95% confidence interval for the difference between the population mean customer satisfaction scores for the two retailers. (Use x, - Xy. Round your answers to two decimal places.) You may need to use the appropriate appendix table or technology to answer this question. A consumer product testing organization uses a survey of readers to obtain customer satisfaction ratings for the nation's largest supermarkets. Each survey respondent is asked to rate a specified supermarket based on a variety of factors such as: quality of products, selection, value, checkout efficiency, service, and store layout. An overall satisfaction score summarizes the rating for each respondent with 100 meaning the respondent is completely satisfied in terms of all factors. Suppose sample data representative of independent samples of two supermarkets' customers are shown below. Supermarket 1 Supermarket 2 n = 270 | n = 300 = 84 Ta = 83 (a) Formulate the null and alternative hypotheses to test whether there is a difference between the population mean customer satisfaction scores for the two retailers. (Let u, = the population mean satisfaction score for Supermarket 1's customers, and let uy = the population mean satisfaction score for Supermarket 2's customers. Enter != for as needed.) Ho: (b) Assume that experience with the satisfaction rating scale indicates that a population standard deviation of 15 is a reasonable assumption for both retailers. Conduct the hypothesis test. Calculate the test statistic. (Use u, - uz. Round your answer to two decimal places.) Report the p-value. (Round your answer to four decimal places.) p-value = At a 0.05 level of significance what is your conclusion? Reject Ho. There is not sufficient evidence to conclude that the population mean satisfaction scores differ for the two retailers. Do not reject Ho. There is not sufficient evidence to conclude that the population mean satisfaction scores differ for the two retailers. Do not reject Ho. There is sufficient evidence to conclude that the population mean satisfaction scores differ for the two retailers. Reject H. There is sufficient evidence to conclude that the population mean satisfaction scores differ for the two retailers. (c) which retailer, if either, appears to have the greater customer satisfaction? Supermarket 1 O Supermarket 2 O neither Provide a 95% confidence interval for the difference between the population mean customer satisfaction scores for the two retailers. (Use x, - Xy. Round your answers to two decimal places.)
Step by Step Solution
There are 3 Steps involved in it

Get step-by-step solutions from verified subject matter experts