

Question: You may need to use the appropriate appendix table or technology to answer this question. In this exercise involving paired differences, consider that it is
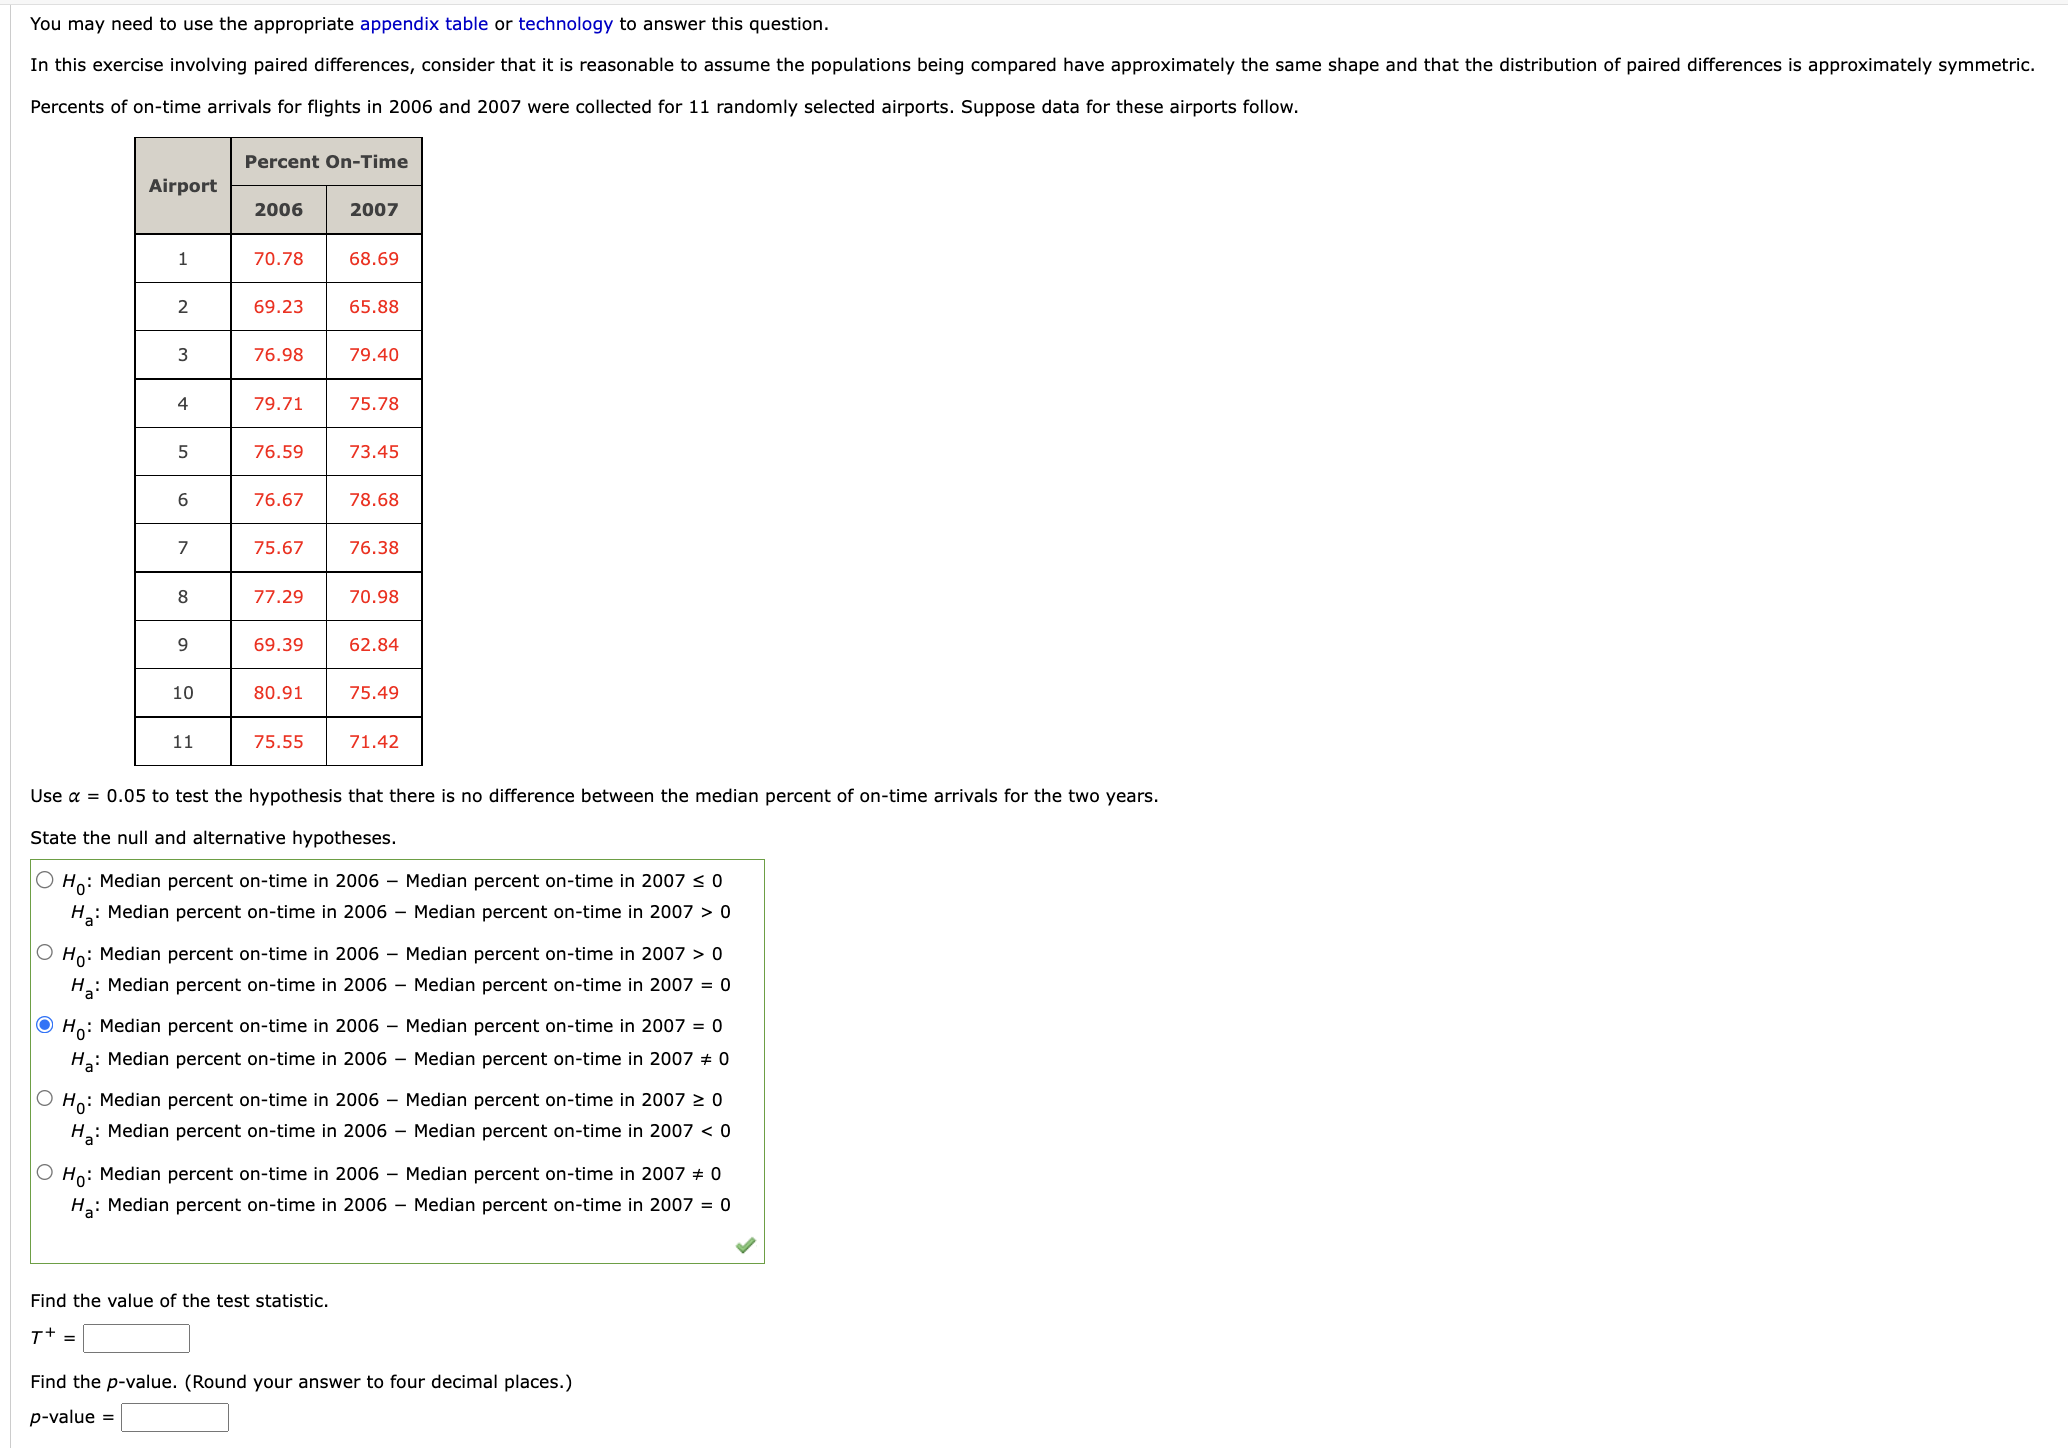
You may need to use the appropriate appendix table or technology to answer this question. In this exercise involving paired differences, consider that it is reasonable to assume the populations being compared have approximately the same shape and that the distribution of paired differences is approximately symmetric. Percents of on-time arrivals for flights in 2006 and 2007 were collected for 11 randomly selected airports. Suppose data for these airports follow. Percent On-Time Airport 1006 2007 1 70.78 68.69 2 69.23 65.88 3 76.98 79.40 4 79.71 75.78 5 76.59 73.45 6 76.67 78.68 7 75.67 76.38 8 77.29 70.98 9 69.39 62.84 10 80.91 75.49 11 75.55 71.42 Use a = 0.05 to test the hypothesis that there is no difference between the median percent of on-time arrivals for the two years. State the null and alternative hypotheses. O HO: Median percent on-time in 2006 7 Median percent on-time in 2007 S 0 Ha: Median percent on-time in 2006 7 Median percent on-time in 2007 > 0 O HO: Median percent on-time in 2006 7 Median percent on-time in 2007 > 0 Ha: Median percent on-time in 2006 7 Median percent on-time in 2007 : 0 (-3 H0: Median percent on-time in 2006 Median percent on-time in 2007 : 0 Ha: Median percent on-time in 2006 7 Median percent on-time in 2007 as 0 0 H0: Median percent on-time in 2006 7 Median percent on-time in 2007 a 0 Ha: Median percent on-time in 2006 7 Median percent on-time in 2007
Step by Step Solution
There are 3 Steps involved in it

Get step-by-step solutions from verified subject matter experts