

Question: You may need to use the appropriate appendix table or technology to answer this question. Consider the following hypothesis test. Ho: My - 1250 The
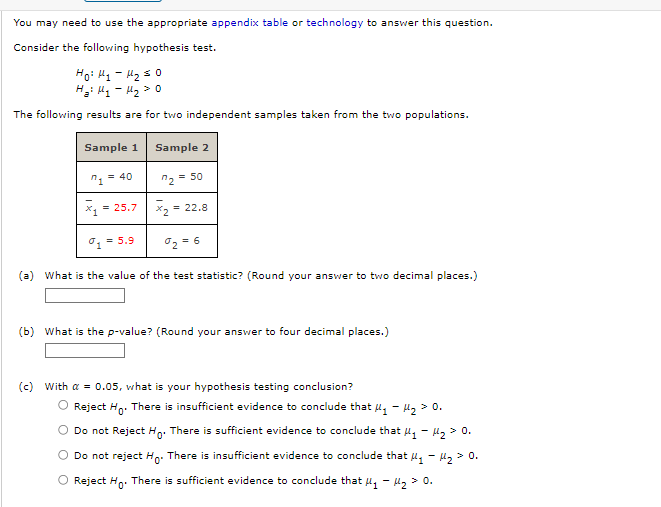
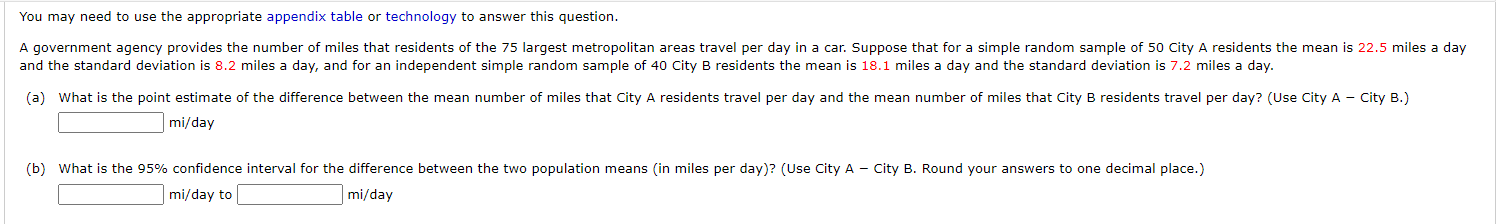
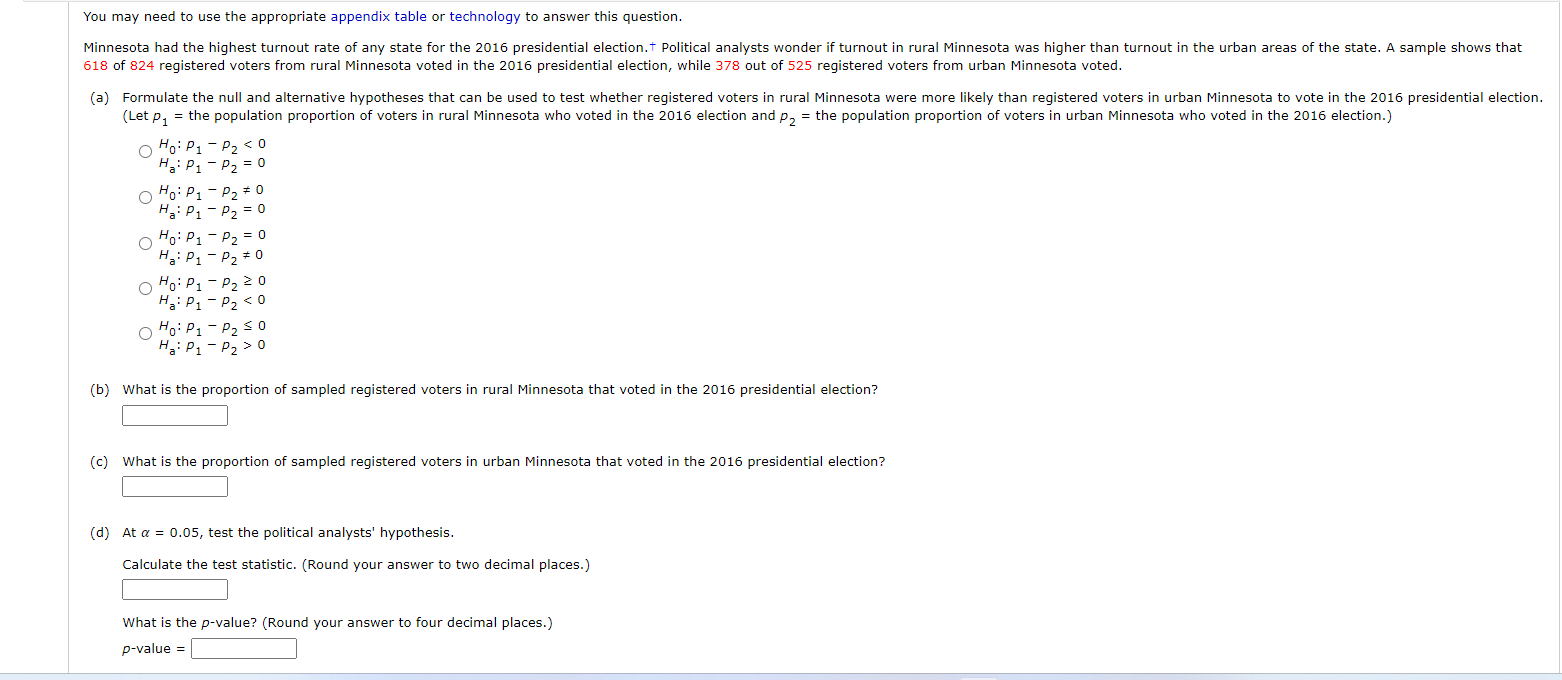
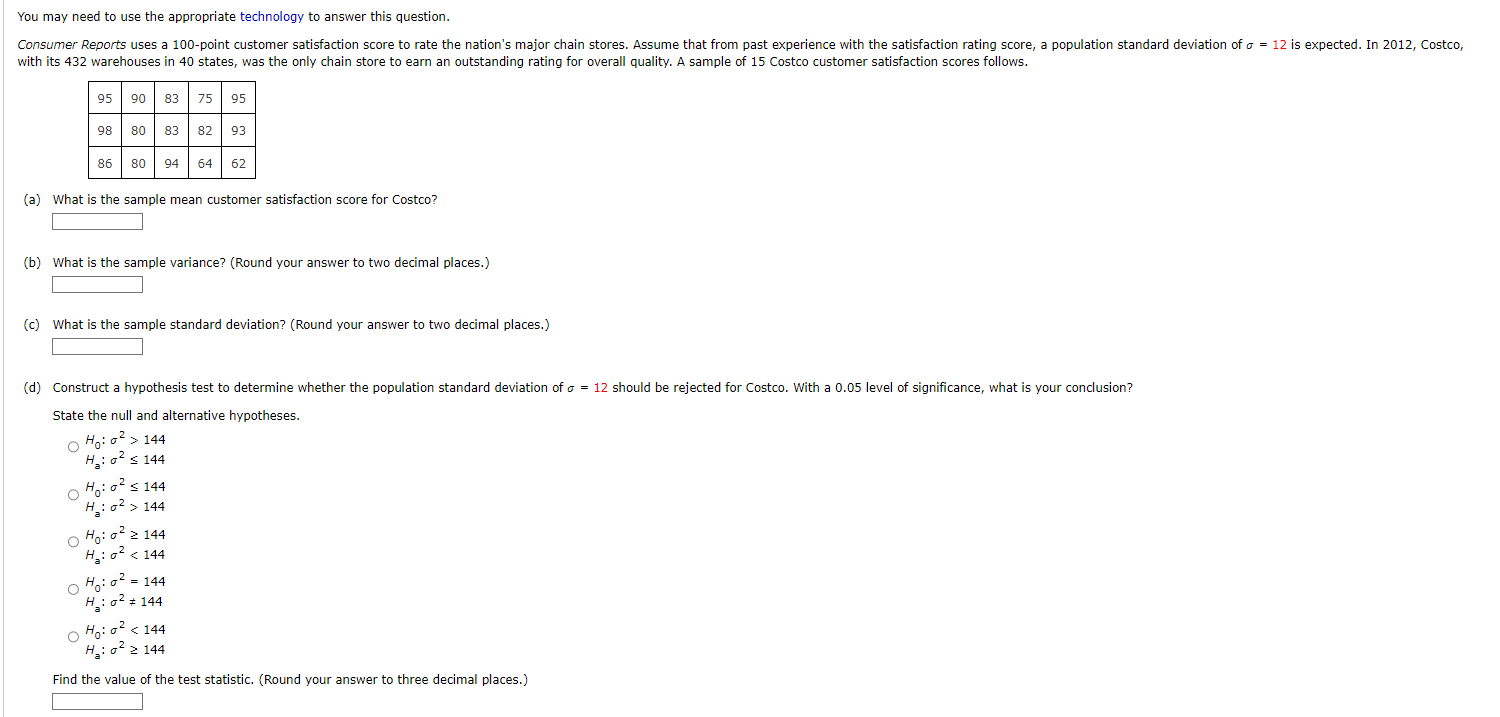

You may need to use the appropriate appendix table or technology to answer this question. Consider the following hypothesis test. Ho: My - 1250 The following results are for two independent samples taken from the two populations. Sample 1 Sample 2 7, = 40 72 = 50 *1 = 25.7 *7 = 22.8 J. =5.9 7, =6 (a) What is the value of the test statistic? (Round your answer to two decimal places.) (b) What is the p-value? (Round your answer to four decimal places.) (c) with a = 0.05, what is your hypothesis testing conclusion? Reject Ho. There is insufficient evidence to conclude that #, - 2 > 0. O Do not Reject Ho. There is sufficient evidence to conclude that My - 1, > 0. O Do not reject Ho. There is insufficient evidence to conclude that , - 1, > 0. O Reject Ho. There is sufficient evidence to conclude that Hy - (2 > 0.You may need to use the appropriate appendix table or technology to answer this question. A government agency provides the number of miles that residents of the 75 largest metropolitan areas travel per day in a car. Suppose that for a simple random sample of 50 City A residents the mean is 22.5 miles a day and the standard deviation is 8.2 miles a day, and for an independent simple random sample of 40 City B residents the mean is 18.1 miles a day and the standard deviation is 7.2 miles a day. (a) What is the point estimate of the difference between the mean number of miles that City A residents travel per day and the mean number of miles that City B residents travel per day? (Use City A - City B.) mi/day (b) What is the 95% confidence interval for the difference between the two population means (in miles per day)? (Use City A - City B. Round your answers to one decimal place.) mi/day to mi/dayYou rnayr need to use the appropriate appendix table or technology to answer this question. Minnesota had the highest turnout rate of any state for the 2016 presidential election." Political analysts wonder if turnout in rural Minnesota was higher than turnout in the urban areas of the state. A sample shows that 618 of 824 registered voters from rural Minnesota voted in the 2016 presidential election, while 378 out of 525 registered voters from urban Minnesota voted. [a) Formulate the null and alternative hypotheses that can be used to test whether registered voters in rural Minnesota were more likely than registered voters in urban Minnesota to vote in the 2016 presidential election. [Let p1 = the population proportion of voters in rural Minnesota who voted in the 2016 election and p2 = the population proportion of Voters in urban Minnesota who voted in the 2016 election.) -p2 144 He: o' = 144 O' H:o $ 144 H_: 0 144 O' H:0- 2 144 H_: o'
Step by Step Solution
There are 3 Steps involved in it

Get step-by-step solutions from verified subject matter experts