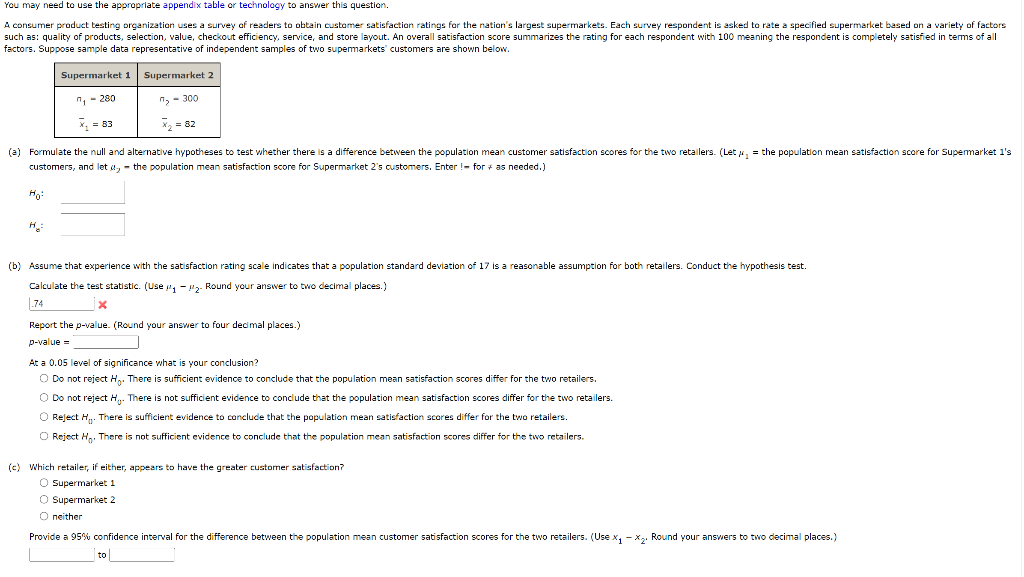
Question: You may need to use the appropriate appendix table or technology to answer this question. factors. Suppose sample data representative of independent samples of two

You may need to use the appropriate appendix

You may need to use the appropriate appendix table or technology to answer this question. factors. Suppose sample data representative of independent samples of two supemarkets' customers are shown below. customers, and let a2= the population mean satisfaction score for Supermarket 2 's customers, Enter ! = for = as needed. ) H0: Hc= Calculate the test statistic. (Use n12 - Round your answer to two decimal places.) Report the p-value. (Round your answer to four decimal places.) p-value = At a 0.05 level of significance what is your conclusion? Do not reject H0. There is sufficient evidence to conclude that the population mean satisfaction scores differ for the two retailers. Do not reject HU. There is not sufficient evidence to conclude that the population mean satisfaction scores differ for the two retailers. Reject H0. There is sufficient evidence to canclude that the population mean satisfaction scores differ for the two retailers. Reject H0, There is not sufficient evidence to conclude that the population mean satisfaction scores differ for the two retailers. (c) Which retailer, if either, appears to have the greater customer satisfaction? Supermarket 1 Supermarket 2 neither to

Step by Step Solution

There are 3 Steps involved in it

1 Expert Approved Answer
Step: 1 Unlock blur-text-image
Question Has Been Solved by an Expert!

Get step-by-step solutions from verified subject matter experts

Step: 2 Unlock
Step: 3 Unlock

Students Have Also Explored These Related General Management Questions!