

Question: You may need to use the appropriate appendix table or technology to answer this question. A report states that adults 18- to 24- years-old
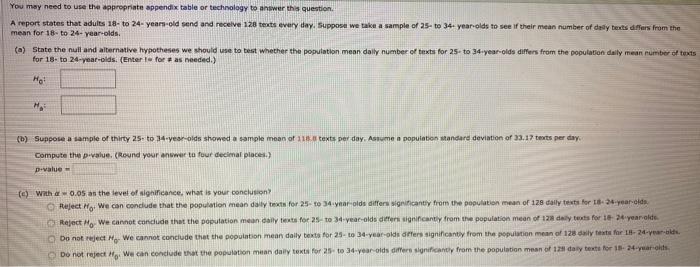
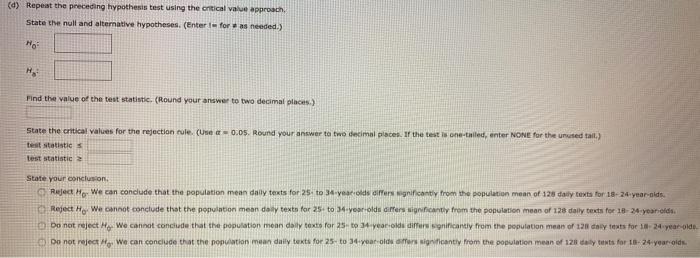
You may need to use the appropriate appendix table or technology to answer this question. A report states that adults 18- to 24- years-old send and recelve 128 texts every day. Suppose we take a sample of 25- to 34- year olds to see if their mean number of daly texts dffers from the mean for 18- to 24- year olds. (a) State the null and alternative hypotheses we should use to test whether the population mean dally number of texts for 25- to 34-year-olds differs from the population daily mean number of texts for 18- to 24-year-olds. (Enter t for as needed.) Ho (b) Suppose a sample of thirty 2s- to 34-year-olds showed a sample mean of 118 texts per day. Assume a popuiation standard deviation of 33.17 texts per day. Compute thep-value. (Round your answer to four decimal places.) p-value = (c) With a -0.05 an the level of sighificance, what is your conclusion OReject Ho We can concdude that the population mean daily texts for 25- to 34 ynar-olds differs significantly from the population mean of 128 daily texts for 18-24-year-olds Reject Ho We cannot condude that the poputation mean daily texts for 25- to 3d-year-olds diefers significantly from the population mean of 128 dely texts for 1824 year olde Do not reject H We cannot conclude thet the population mean daily texts for 25- to 34-year-olds affers significantly from the population mean of 128 daily tests for L8-24-year-lds. Do not reject H We can conclude that the population mean daily texta for 25- to 34-year-olds difers significanty from the population mean of 12 daly texts for 18-24-yuar okts (4) Repeat the preceding hypothesis test using the onitical value approach, State the nult and alternative hypotheses. (Enter for as needed.) Find the value of the test statistic. (Round your answer to two decimal places.) State the critical values for the rejection rule. (Use a=0.05. Round your answer to two decimal places. If the test is one-tailed, enter NONE for the unused tail.) test statisticS test statistic2 State your conclusion. Reject H We can condude that the population mean daily texts for 25 to 34-veariolds difers ignificantly from the population mean of 128 daily texts for 18-24-year-oids. TReject He We cannot conclude that the population mean daly texta for 25- to 34-yeariolds difers significanty from the population mean of 128 daly texts for 18-24-yeanoids. Do not reject H We cannot conciude that the population mean dally texts for 25- to 34 yearioldi differs sgnificantiy from the population mean of 128 daly texts for 1 24 year-olds. ODo not reject H We can conciude that the population mean daily texts for 25- to 34-yoar-olds amers significantly from the population mean of 128 daly texts for 18-24-year olds
Step by Step Solution
3.49 Rating (149 Votes )
There are 3 Steps involved in it
Ho ll 128 Two Teso teiled tead Hiide 128 n30 1188 o3317 Sigma IB hnown Do we upe the Standard n... View full answer

Get step-by-step solutions from verified subject matter experts