

Question: You may need to use the appropriate appendix table or technology to answer this question. Suppose taxpayers calling the IRS in 2017 waited 13 minutes
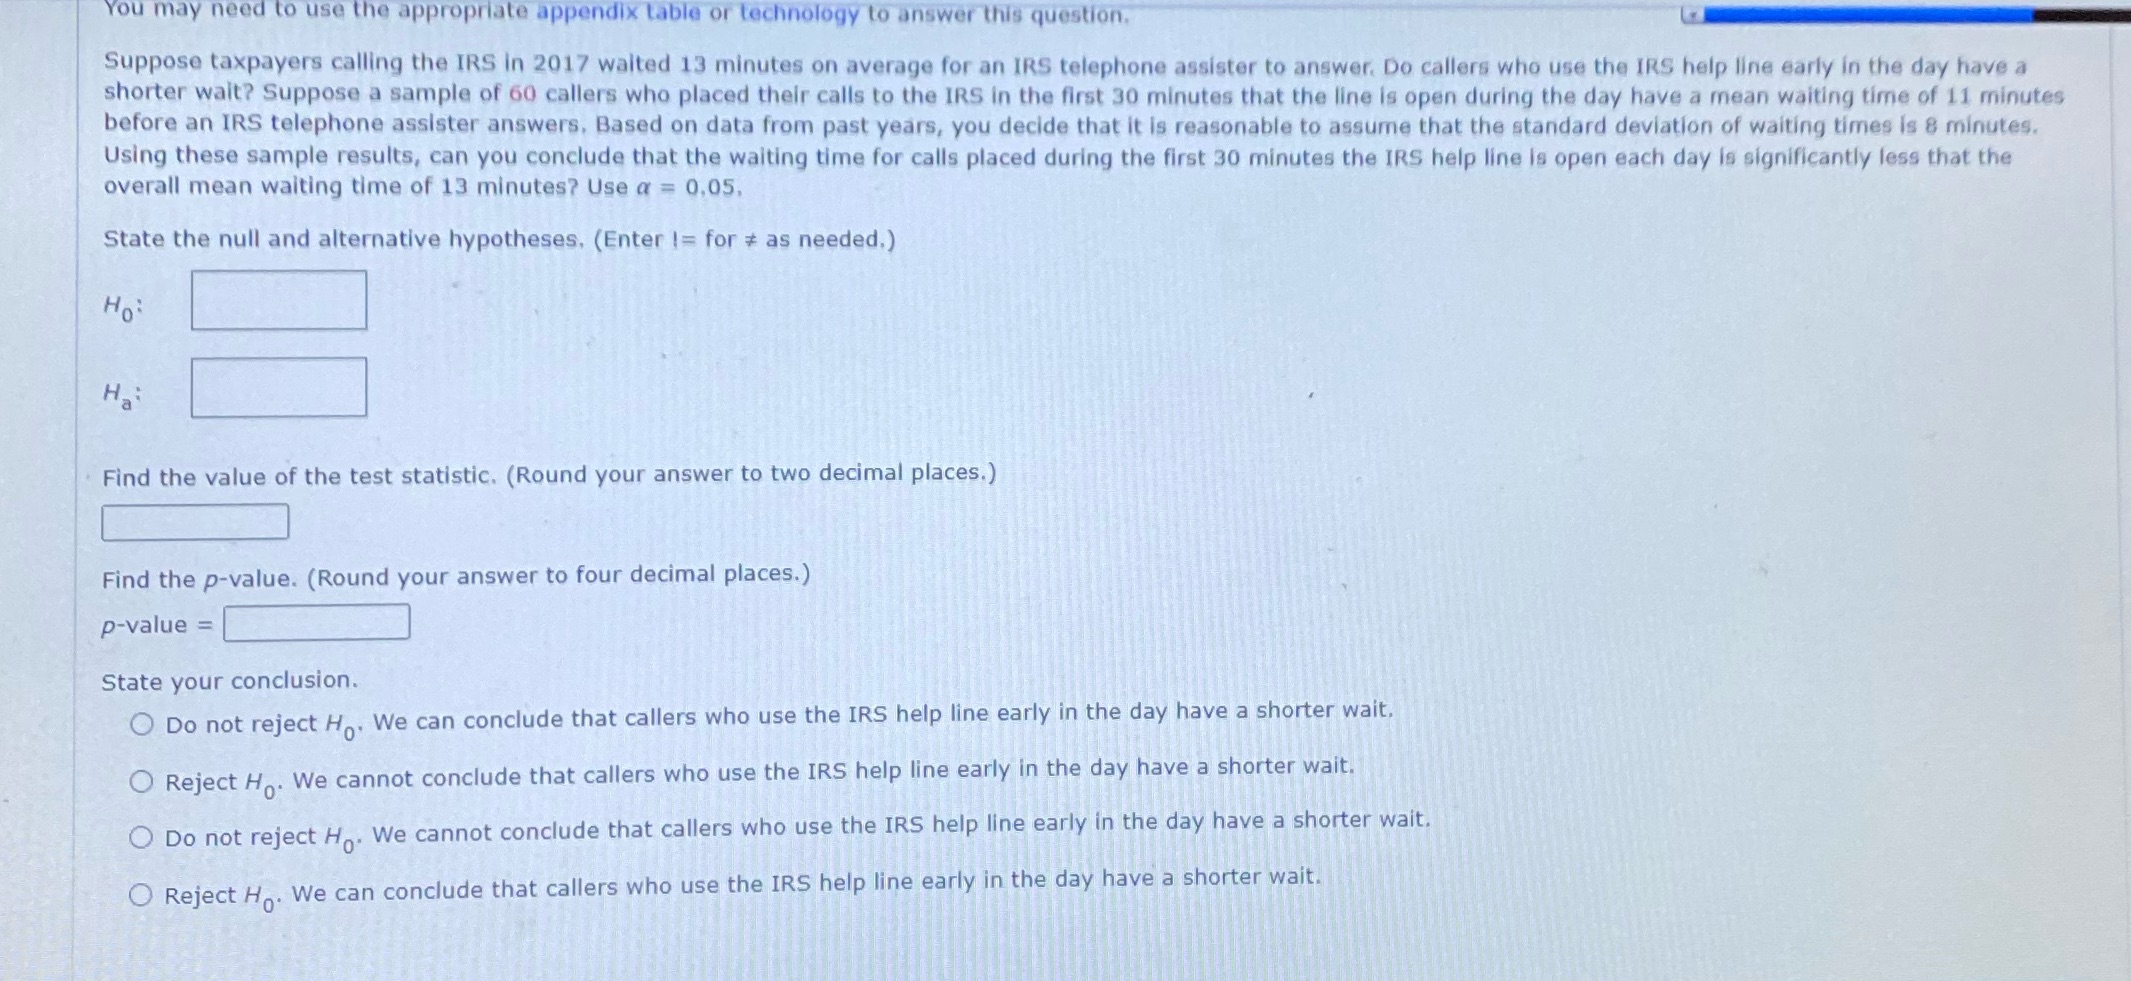
You may need to use the appropriate appendix table or technology to answer this question. Suppose taxpayers calling the IRS in 2017 waited 13 minutes on average for an IRS telephone assister to answer. Do callers who use the IRS help line early in the day have a shorter wait? Suppose a sample of 60 callers who placed their calls to the IRS in the first 30 minutes that the line is open during the day have a mean waiting time of 11 minutes before an IRS telephone assister answers, Based on data from past years, you decide that it is reasonable to assume that the standard deviation of waiting times is 8 minutes. Using these sample results, can you conclude that the waiting time for calls placed during the first 30 minutes the IRS help line is open each day is significantly less that the overall mean waiting time of 13 minutes? Use a = 0,05, State the null and alternative hypotheses, (Enter != for # as needed.) Ho Find the value of the test statistic. (Round your answer to two decimal places.) Find the p-value. (Round your answer to four decimal places.) p-value = State your conclusion. O Do not reject Ho. We can conclude that callers who use the IRS help line early in the day have a shorter wait. O Reject Ho. We cannot conclude that callers who use the IRS help line early in the day have a shorter wait. O Do not reject Ho. We cannot conclude that callers who use the IRS help line early in the day have a shorter wait. O Reject Ho. We can conclude that callers who use the IRS help line early in the day have a shorter wait
Step by Step Solution
There are 3 Steps involved in it

Get step-by-step solutions from verified subject matter experts