

Question: You may need to use the appropriate appendix table to answer this question. This exercise is a what-if analyses designed to determine what happens to
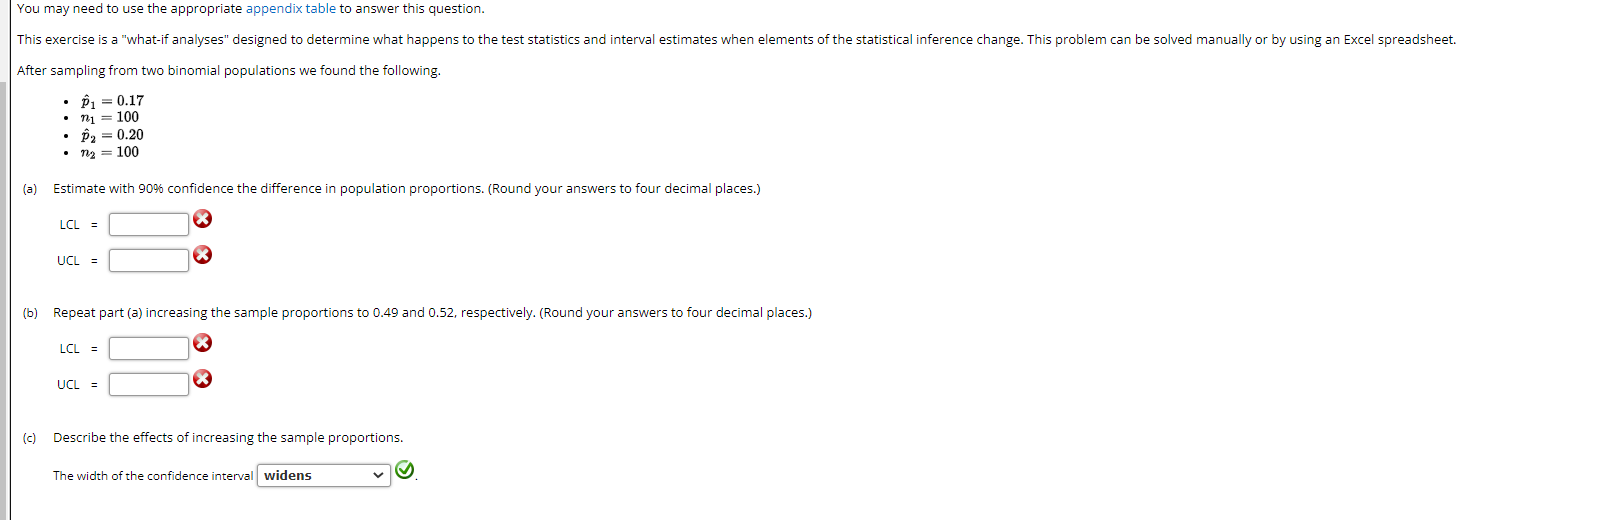

You may need to use the appropriate appendix table to answer this question. This exercise is a "what-if analyses" designed to determine what happens to the test statistics and interval estimates when elements of the statistical inference change. This problem can be solved manually or by using an Excel spreadsheet. After sampling from two binomial populations we found the following. P1 = 0.17 71 = 100 P2 = 0.20 n2 = 100 (a) Estimate with 90% confidence the difference in population proportions. (Round your answers to four decimal places.) X LCL = UCL = X (b) Repeat part (a) increasing the sample proportions to 0.49 and 0.52, respectively. (Round your answers to four decimal places.) LCL = UCL = (c) Describe the effects of increasing the sample proportions. The width of the confidence interval widens V O
Step by Step Solution
There are 3 Steps involved in it

Get step-by-step solutions from verified subject matter experts