

Question: You may need to use the appropriate technology to answer this question. A production line operation is tested for filling weight accuracy using the following
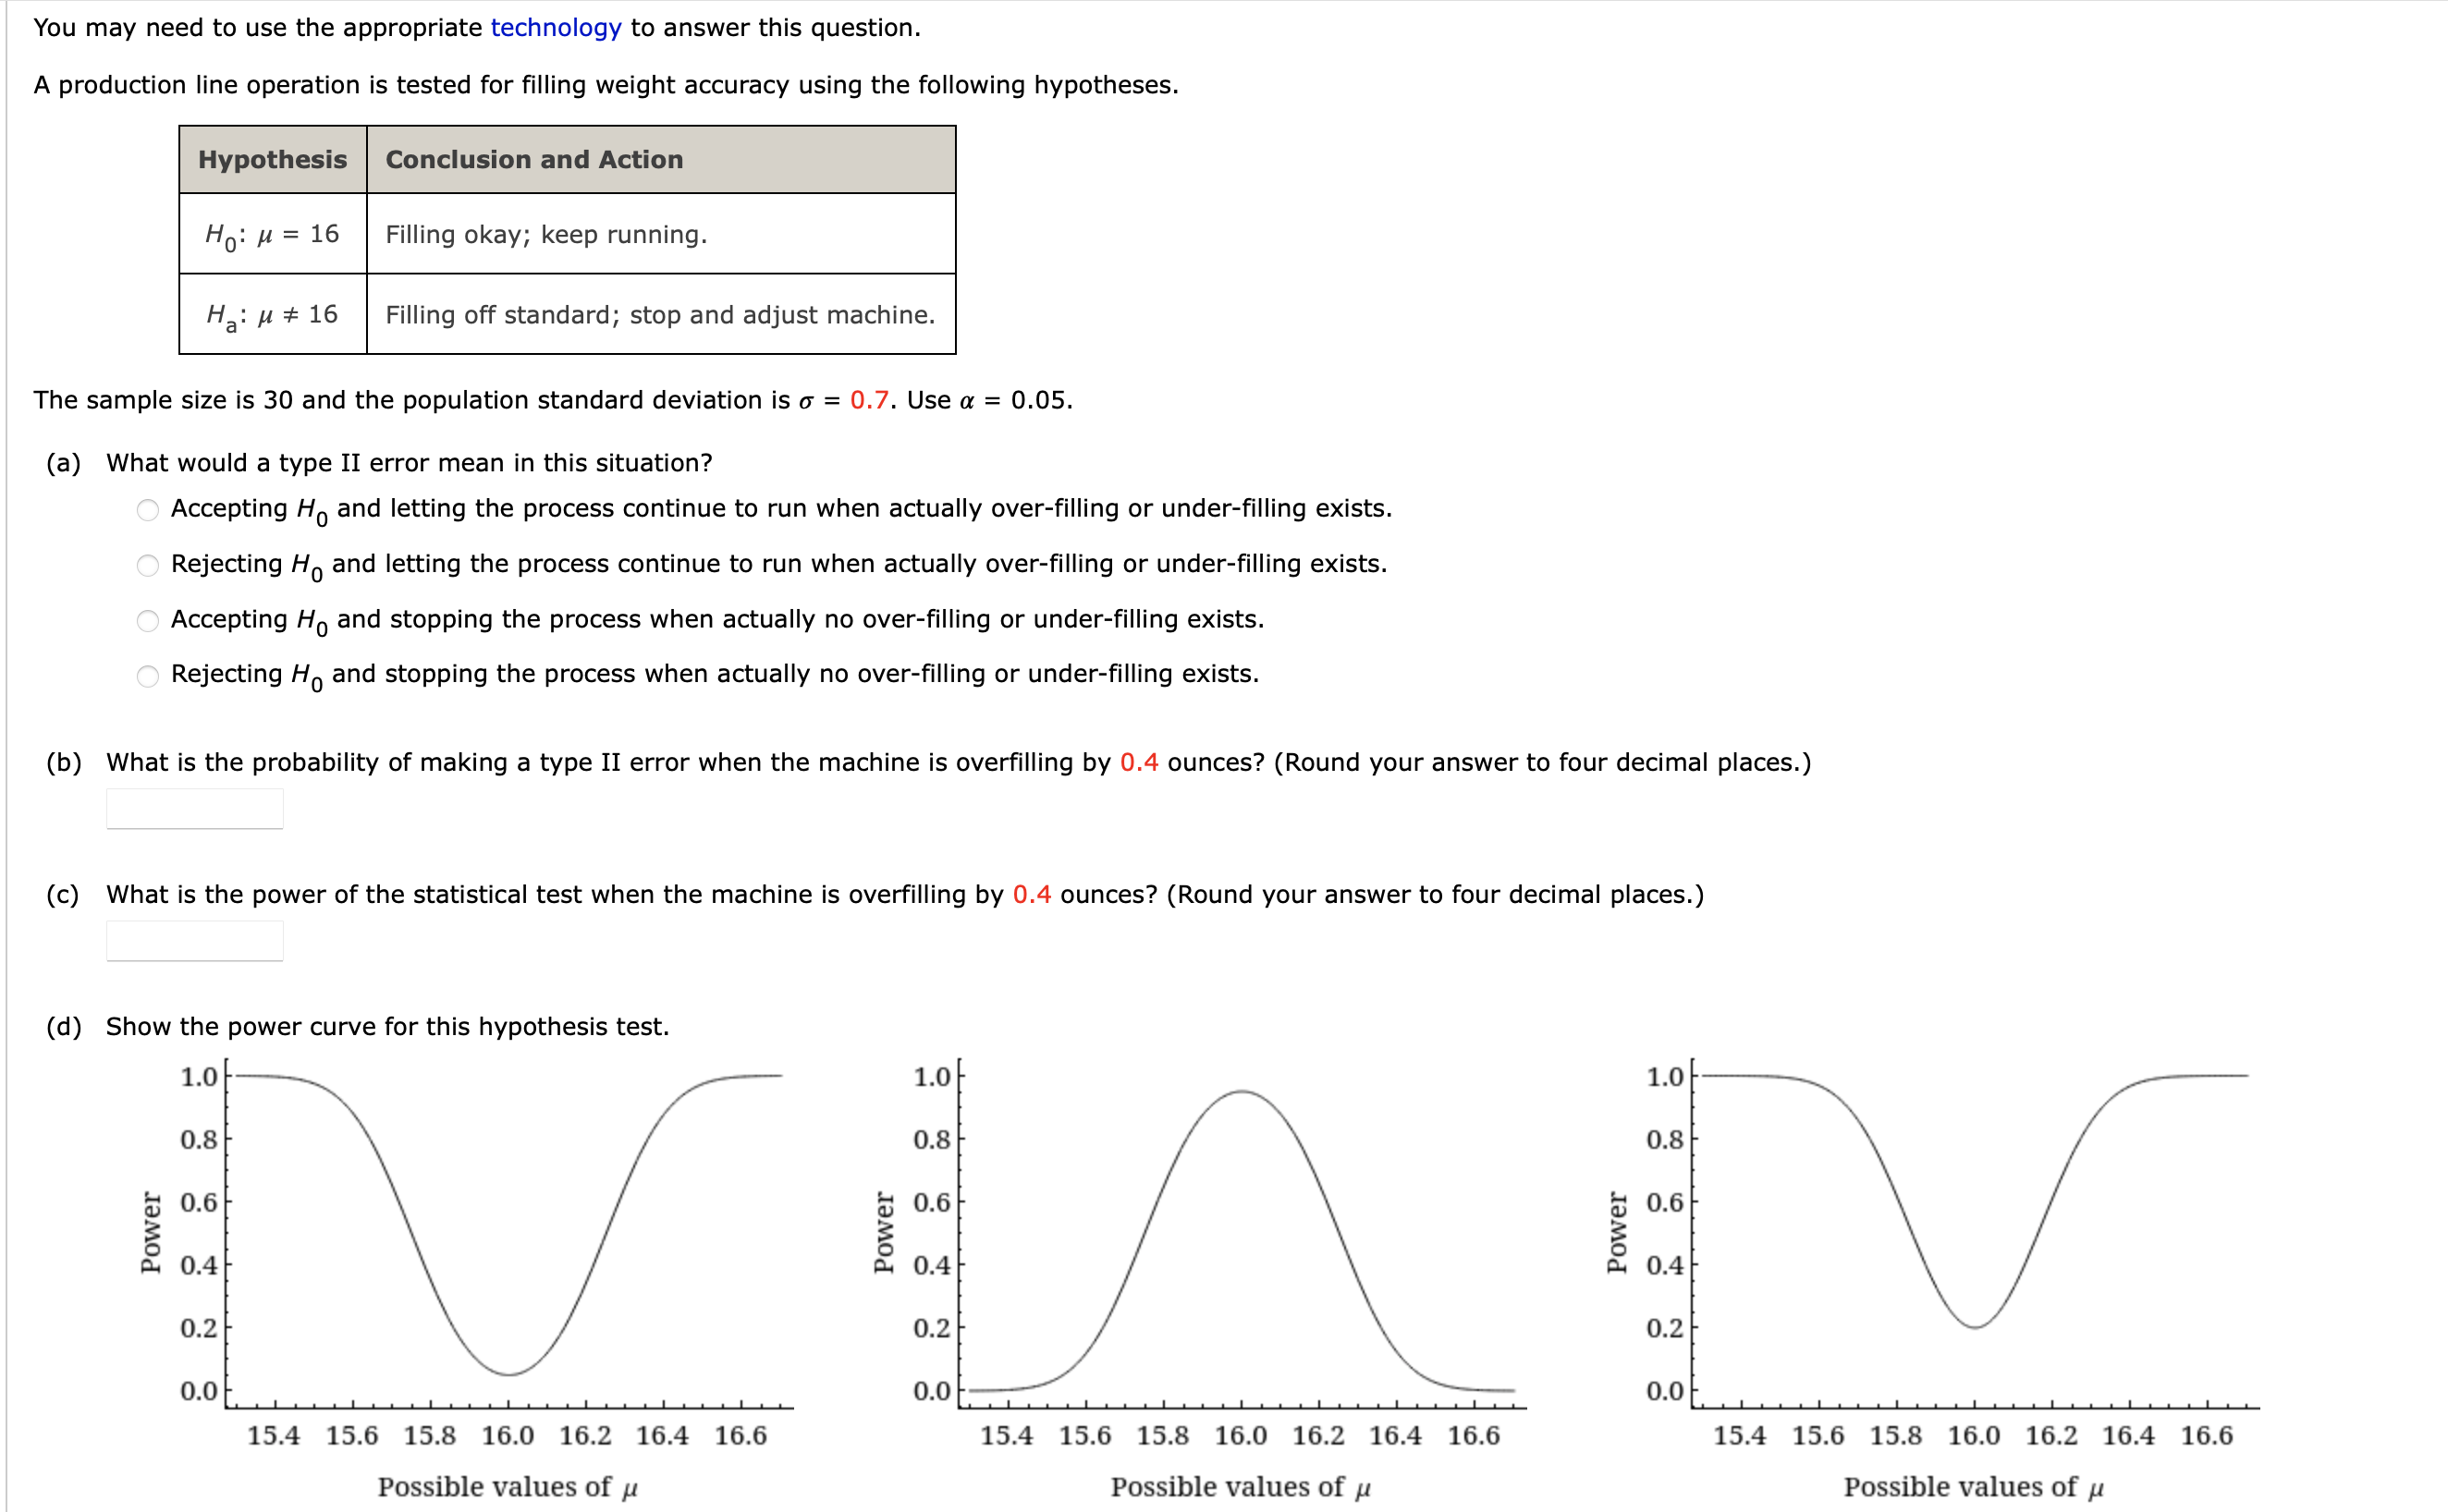
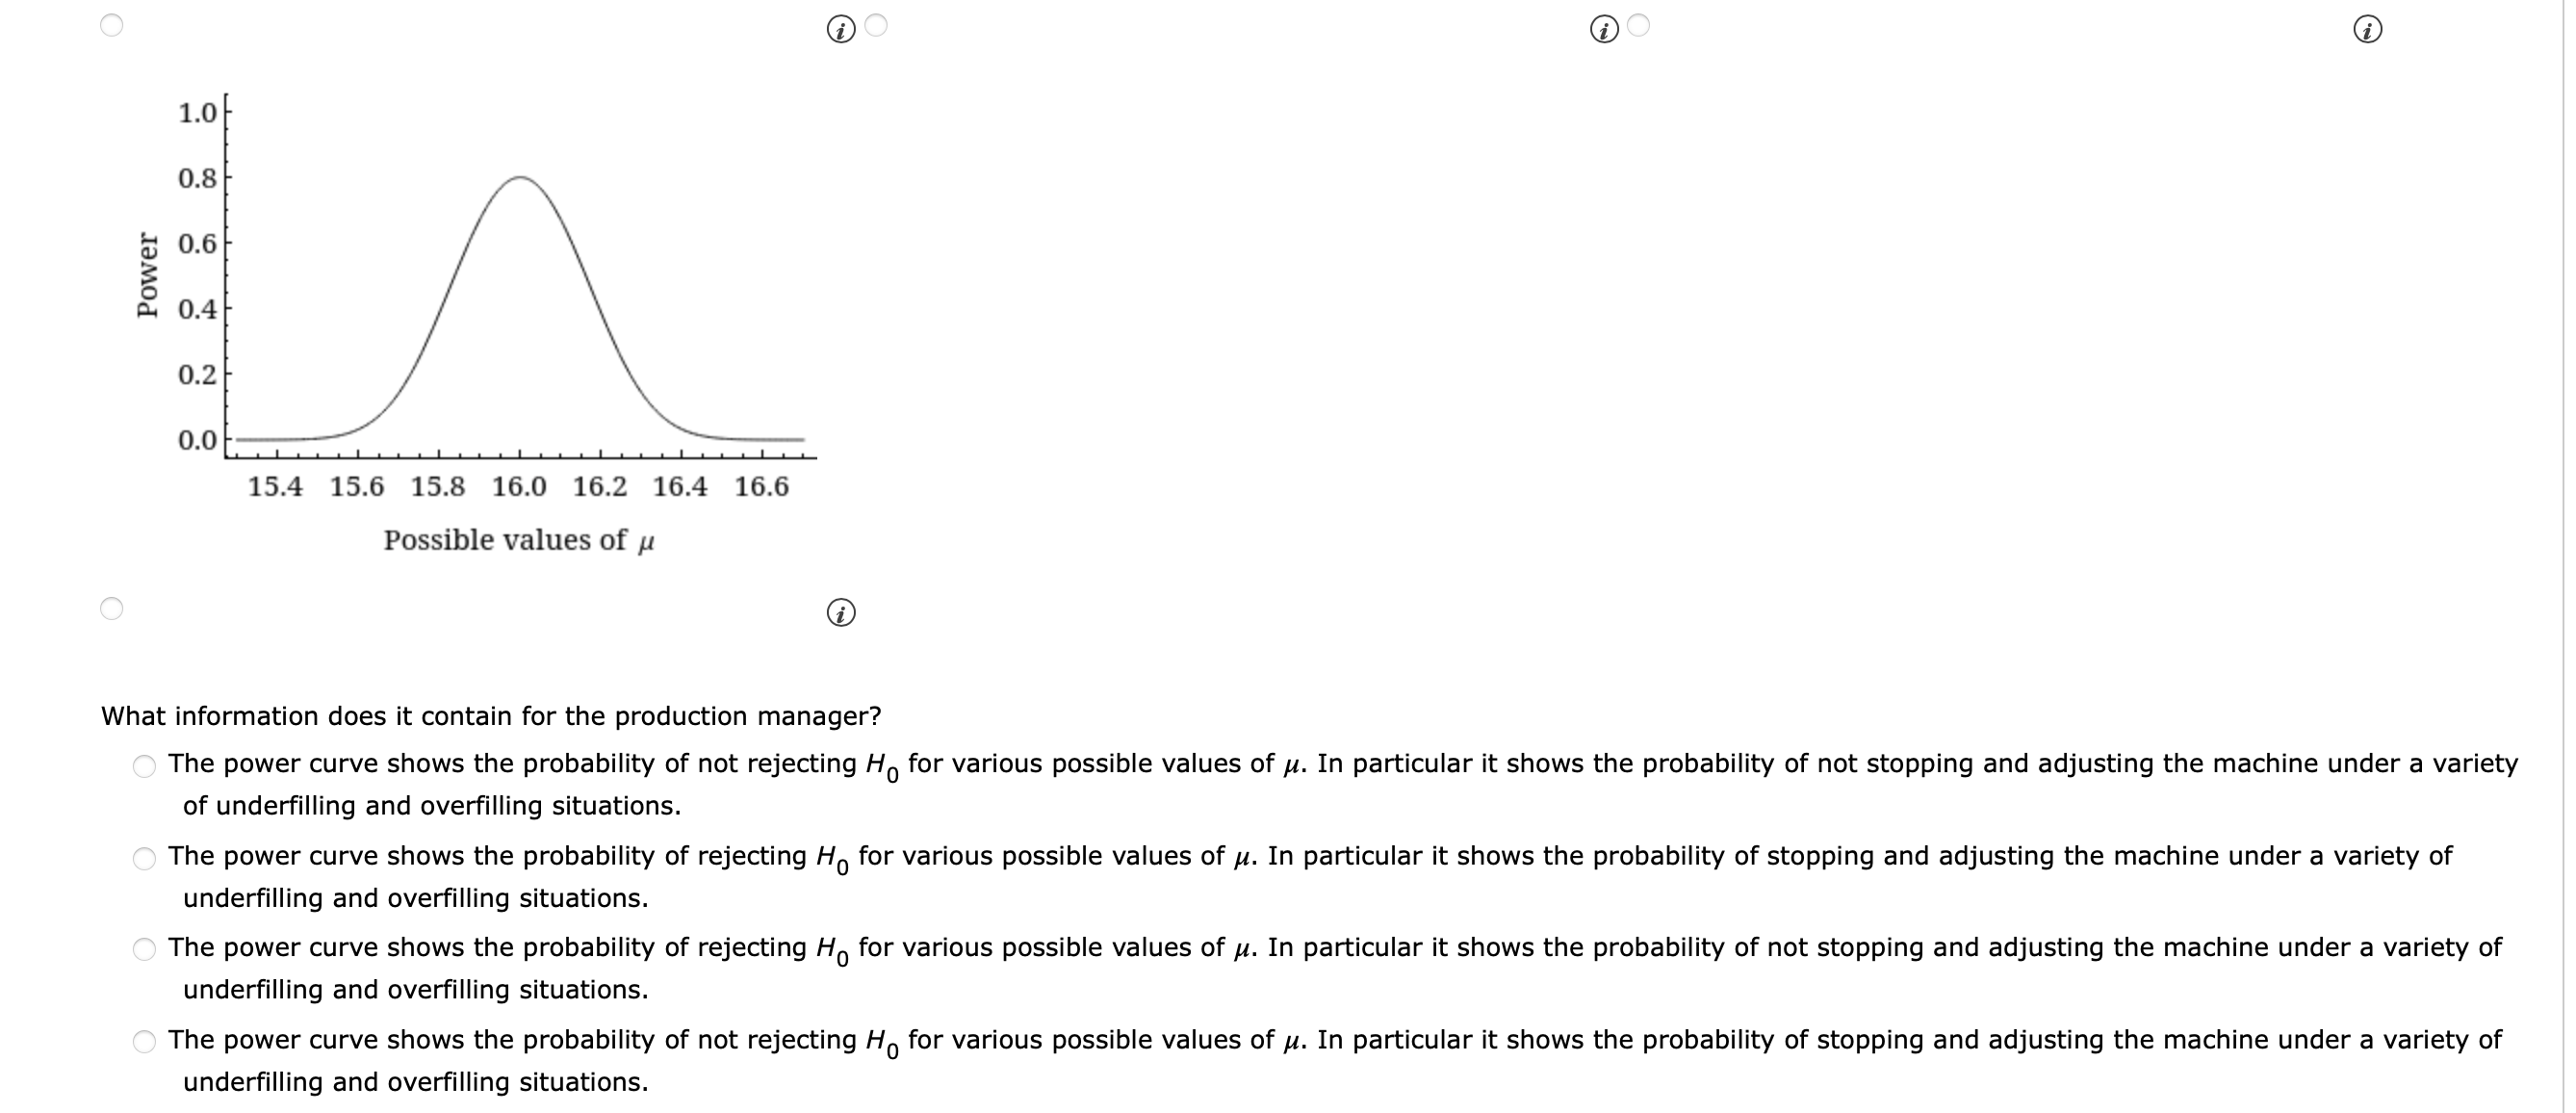
You may need to use the appropriate technology to answer this question. A production line operation is tested for filling weight accuracy using the following hypotheses. Hypothesis Conclusion and Action Ho: M = 16 Filling okay; keep running. Ha: M # 16 Filling off standard; stop and adjust machine. The sample size is 30 and the population standard deviation is o = 0.7. Use a = 0.05. (a) What would a type II error mean in this situation? O Accepting Ho and letting the process continue to run when actually over-filling or under-filling exists. Rejecting Ho and letting the process continue to run when actually over-filling or under-filling exists. O Accepting Ho and stopping the process when actually no over-filling or under-filling exists. Rejecting Ho and stopping the process when actually no over-filling or under-filling exists. (b) What is the probability of making a type II error when the machine is overfilling by 0.4 ounces? (Round your answer to four decimal places.) (c) What is the power of the statistical test when the machine is overfilling by 0.4 ounces? (Round your answer to four decimal places.) (d) Show the power curve for this hypothesis test. 1.0 1.0/ 1.0/ 0.8 0.8 0.8 0.6 0.6 0.6 Power Power POV 0.4 4 0.4 0.4 0.2 0.2 0.2 0.0 0.0 0.0 15.4 15.6 15.8 16.0 16.2 16.4 16.6 15.4 15.6 15.8 16.0 16.2 16.4 16.6 15.4 15.6 15.8 16.0 16.2 16.4 16.6 Possible values of u Possible values of u Possible values of uO 1.0/ 0.8 0.6 Power 0.4 0.2 0.0 15.4 15.6 15.8 16.0 16.2 16.4 16.6 Possible values of u What information does it contain for the production manager? The power curve shows the probability of not rejecting Ho for various possible values of M. In particular it shows the probability of not stopping and adjusting the machine under a variety of underfilling and overfilling situations. The power curve shows the probability of rejecting Ho for various possible values of . In particular it shows the probability of stopping and adjusting the machine under a variety of underfilling and overfilling situations. The power curve shows the probability of rejecting Ho for various possible values of . In particular it shows the probability of not stopping and adjusting the machine under a variety of underfilling and overfilling situations. O The power curve shows the probability of not rejecting Ho for various possible values of . In particular it shows the probability of stopping and adjusting the machine under a variety of underfilling and overfilling situations
Step by Step Solution
There are 3 Steps involved in it

Get step-by-step solutions from verified subject matter experts