

Question: You may need to use this table to answer this question. The foll centigri manufacturing process at Kensport Chemical Company. The data show the temperature
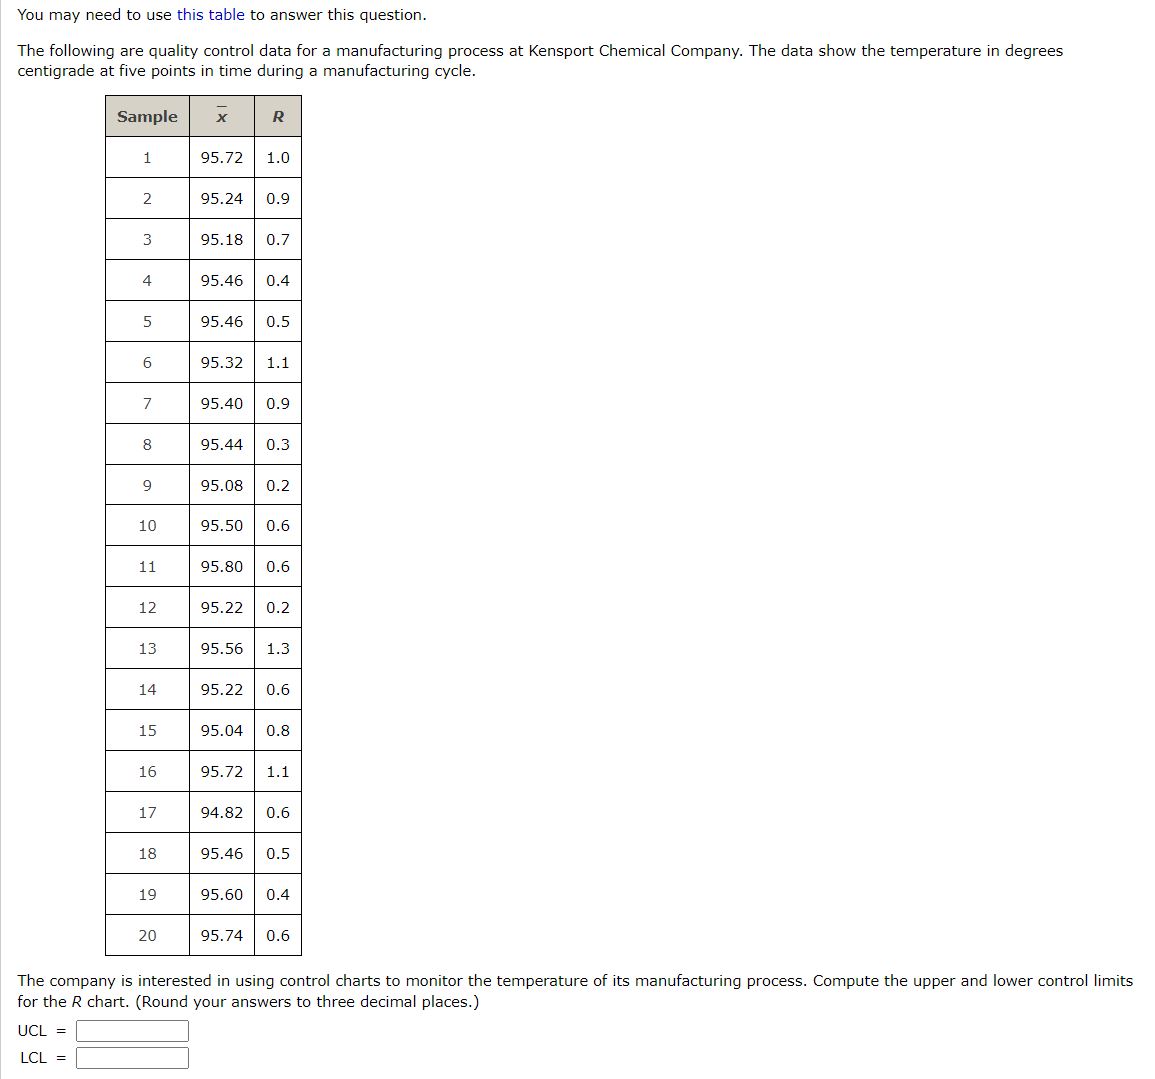
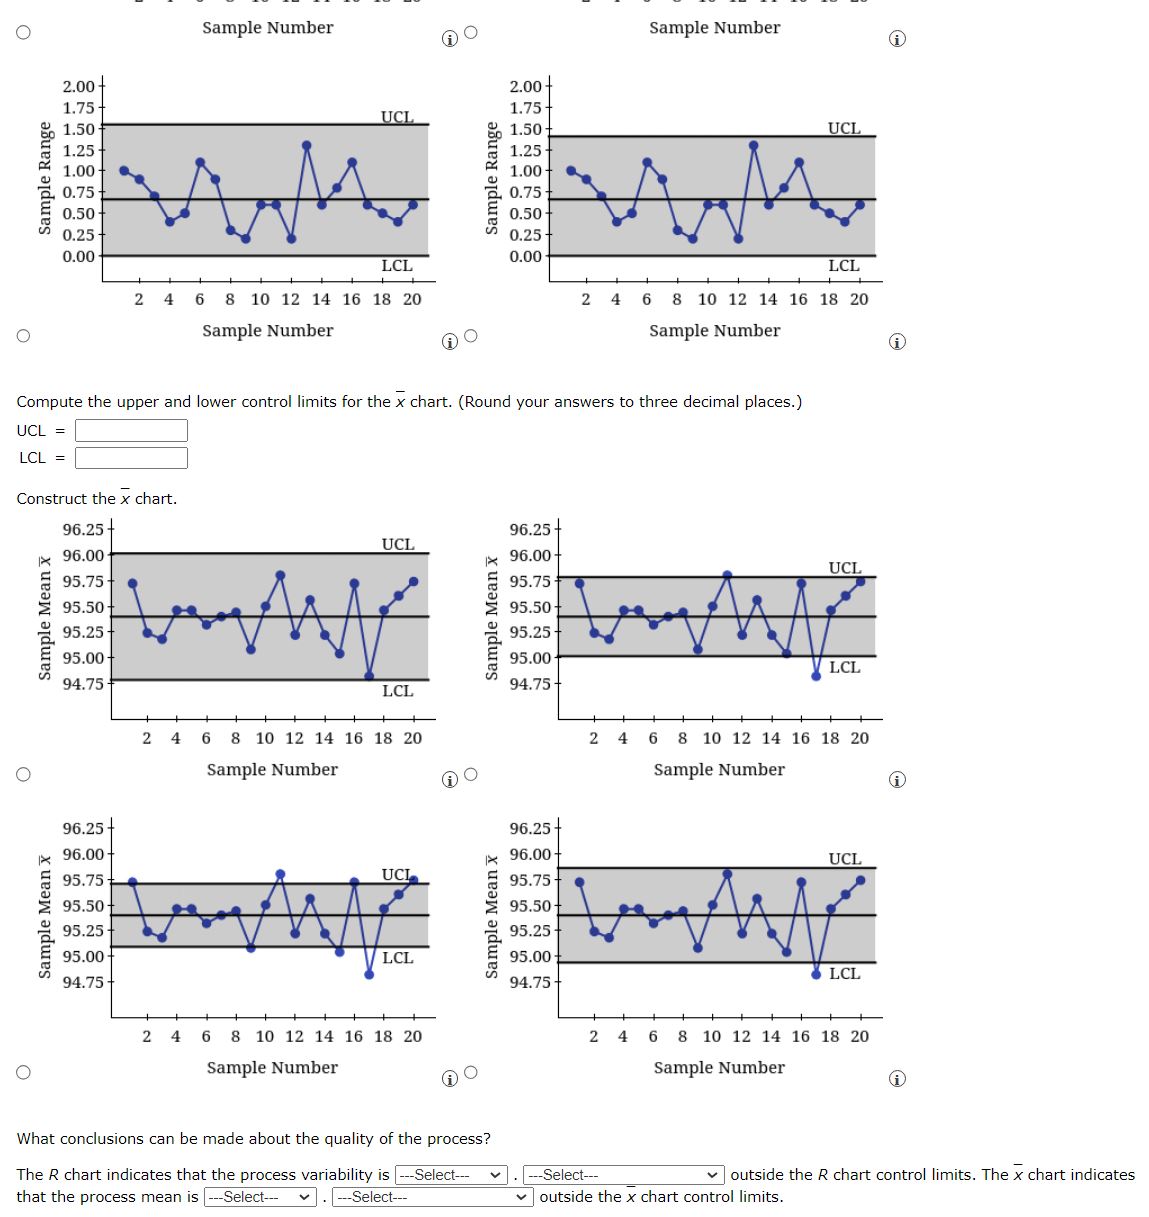
You may need to use this table to answer this question. The foll centigri manufacturing process at Kensport Chemical Company. The data show the temperature in degrees anufacturing cycle. The company is interested in using control charts to monitor the temperature of its manufacturing process. Compute the upper and lower control limits for the \\( R \\) chart. (Round your answers to three decimal places.) \\[ \\begin{array}{l} \\mathrm{UCL}= \\\\ \\mathrm{LCL}= \\end{array} \\] Compute the upper and lower control limits for the \\( \\bar{x} \\) chart. (Round your answers to three decimal places.) \\[ \\begin{array}{l} \\mathrm{UCL}= \\\\ \\mathrm{LCL}= \\end{array} \\] Construct the \\( \\bar{x} \\) chart. ) C C What conclusions can be made about the quality of the process? The \\( R \\) chart indicates that the process variability is that the process mean is outside the \\( R \\) chart control limits. The \\( \\bar{x} \\) chart indicates outside the \\( x \\) chart control limits. You may need to use this table to answer this question. The foll centigri manufacturing process at Kensport Chemical Company. The data show the temperature in degrees anufacturing cycle. The company is interested in using control charts to monitor the temperature of its manufacturing process. Compute the upper and lower control limits for the \\( R \\) chart. (Round your answers to three decimal places.) \\[ \\begin{array}{l} \\mathrm{UCL}= \\\\ \\mathrm{LCL}= \\end{array} \\] Compute the upper and lower control limits for the \\( \\bar{x} \\) chart. (Round your answers to three decimal places.) \\[ \\begin{array}{l} \\mathrm{UCL}= \\\\ \\mathrm{LCL}= \\end{array} \\] Construct the \\( \\bar{x} \\) chart. ) C C What conclusions can be made about the quality of the process? The \\( R \\) chart indicates that the process variability is that the process mean is outside the \\( R \\) chart control limits. The \\( \\bar{x} \\) chart indicates outside the \\( x \\) chart control limits
Step by Step Solution
There are 3 Steps involved in it

Get step-by-step solutions from verified subject matter experts