

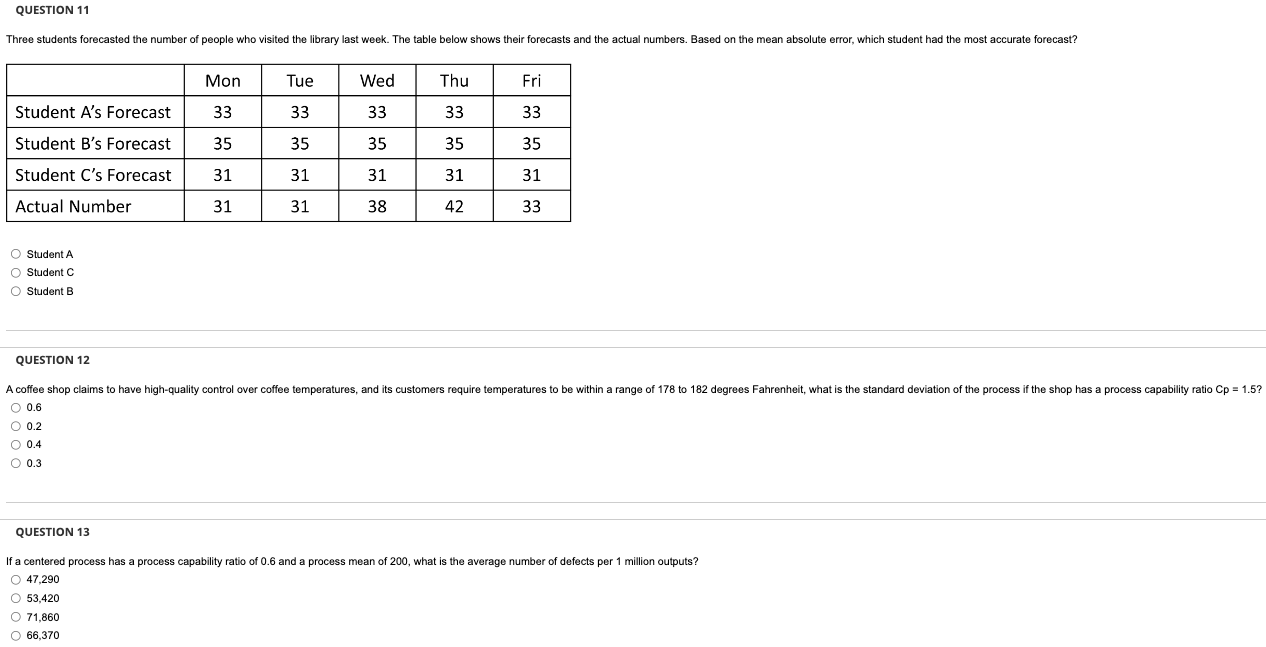
Question: __________________________________________________________________________________________________ You might need to use chart below to answer question. Student A Student C Student B QUESTION 12 0.6 0.2 0.4 0.3 QUESTION 13
__________________________________________________________________________________________________
You might need to use chart below to answer question.
Student A Student C Student B QUESTION 12 0.6 0.2 0.4 0.3 QUESTION 13 If a centered process has a process capability ratio of 0.6 and a process mean of 200 , what is the average number of defects per 1 million outputs? 47,290 53,420 71,860 66,370 =
Step by Step Solution
There are 3 Steps involved in it
1 Expert Approved Answer
Step: 1 Unlock

Question Has Been Solved by an Expert!
Get step-by-step solutions from verified subject matter experts
Step: 2 Unlock
Step: 3 Unlock