

Question: You need the excel spreadsheet provided that has raw data for Raytheon Company and the Standard & Poors 500 Index. Suppose you have been hired
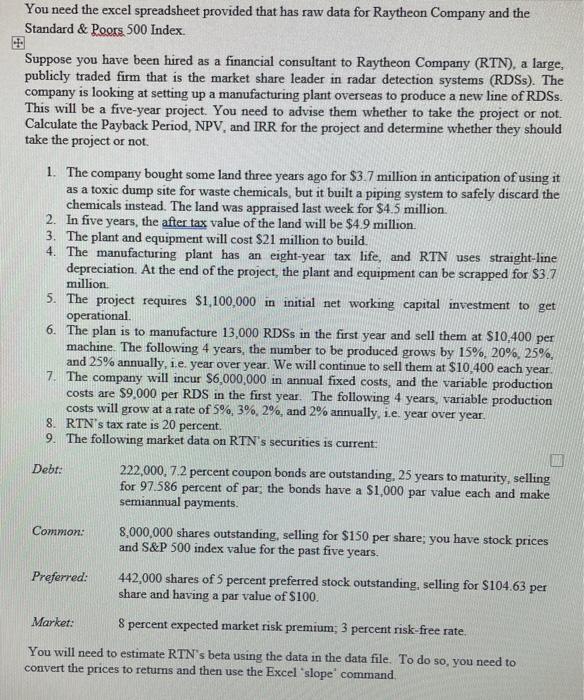
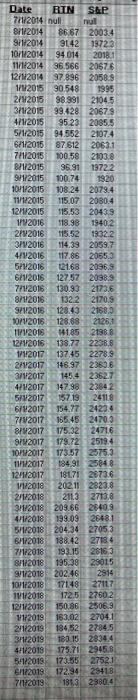
You need the excel spreadsheet provided that has raw data for Raytheon Company and the Standard & Poors 500 Index. Suppose you have been hired as a financial consultant to Raytheon Company (RTN), a large, publicly traded firm that is the market share leader in radar detection systems (RDS). The company is looking at setting up a manufacturing plant overseas to produce a new line of RDSs. This will be a five-year project. You need to advise them whether to take the project or not. Calculate the Payback Period, NPV, and IRR for the project and determine whether they should take the project or not. 1. The company bought some land three years ago for $3.7 million in anticipation of using it as a toxic dump site for waste chemicals, but it built a piping system to safely discard the chemicals instead. The land was appraised last week for $4.5 million. 2. In five years, the after tax value of the land will be $4.9 million 3. The plant and equipment will cost $21 million to build. 4. The manufacturing plant has an eight-year tax life, and RTN uses straight-line depreciation. At the end of the project, the plant and equipment can be scrapped for $3.7 million 5. The project requires $1,100,000 in initial networking capital investment to get operational 6. The plan is to manufacture 13,000 RDSs in the first year and sell them at $10,400 per machine. The following 4 years, the number to be produced grows by 15%, 20%, 25%. and 25% annually, i.e. year over year. We will continue to sell them at $10,400 each year 7. The company will incur $6,000,000 in annual fixed costs, and the variable production costs are $9.000 per RDS in the first year. The following 4 years, variable production costs will grow at a rate of 5%, 3%, 2%, and 2% annually, i.e. year over year 8. RTN's tax rate is 20 percent. 9. The following market data on RTN's securities is current: Debt: 222,000.7.2 percent coupon bonds are outstanding. 25 years to maturity, selling for 97.586 percent of par; the bonds have a $1,000 par value each and make semiannual payments. Common: 8,000,000 shares outstanding, selling for $150 per share; you have stock prices and S&P 500 index value for the past five years. Preferred: 442,000 shares of 5 percent preferred stock outstanding, selling for $104.63 per share and having a par value of $100. Market: 8 percent expected market risk premium; 3 percent risk-free rate. You will need to estimate RTN's beta using the data in the data file. To do so, you need to convert the prices to returns and then use the Excel slope command Date RIN S&P 72/2014 null mul 811/2014 86.67 2003.4 S11/2014 9142 13722 10/1/2014 94014 2018.1 11/1/2014 96.566 20676 1211/2014 97.896 2058.9 1/2015 90548 1995 2142015 98.991 21045 3/1/2015 99.428 20679 4/1/2015 95.23 2085,5 5/1/2015 94.552 2107.4 671/2015 87 612 20631 711/2015 100.58 2103.8 8/1/2015 96.91 19722 9/1/2015 100.74 1920 10/1/2015 108.24 20794 11/1/2015 115.07 2080.4 12/11/2015 115.53 20439 12016 118.98 1940:2 271 2016 115.52 1932.2 3/2016 114.39 2059,7 4712016 117.86 20553 6P12016 12168 20969 6/1/2016 127.57 2038.3 771/2016 130.93 2173.6 8742016 1322 2170.9 921/2015 128.43 2168.3 10/12016 128.68 212521 11/1/2018 44185 21988 12112016 138.77 2238.8 11/2017 137.45 22789 211/2017 146.97 23636 3/11/2017 145.4 23627 4712017 147.98 23842 5/2017 157.19 24118 6142017 154.77 24234 7192017 165.45 2470.3 BIM2017 175.32 2471 792017 179.72 2519.4 10/2017 173.57 25753 11/2017 184.91 2584 1211/2017 181.71 26736 1/1/2018 202.11 2823.8 2/1/2018 2113 2713,8 3/1/2018 209.66 2640.9 01/2018 199.09 26481 571/2018 204,34 27053 8/1/2018 188.42 27184 7712018 193.15 26163 81.2018 195.38 2015 01/2018 202.46 2914 10/1/2018 171.48 2717 11/1/2018 172.5 2760.2 12/1/2018 150.86 25069 412019 163,02 2704.1 2/1/2018 184,52 2784.5 371/2019 180.15 2834.4 4:1/2018 175.71 2945.8 51/2013 173.55 27521 67172019 172.94 29418 7/1/2019 1913 2380-4 You need the excel spreadsheet provided that has raw data for Raytheon Company and the Standard & Poors 500 Index. Suppose you have been hired as a financial consultant to Raytheon Company (RTN), a large, publicly traded firm that is the market share leader in radar detection systems (RDS). The company is looking at setting up a manufacturing plant overseas to produce a new line of RDSs. This will be a five-year project. You need to advise them whether to take the project or not. Calculate the Payback Period, NPV, and IRR for the project and determine whether they should take the project or not. 1. The company bought some land three years ago for $3.7 million in anticipation of using it as a toxic dump site for waste chemicals, but it built a piping system to safely discard the chemicals instead. The land was appraised last week for $4.5 million. 2. In five years, the after tax value of the land will be $4.9 million 3. The plant and equipment will cost $21 million to build. 4. The manufacturing plant has an eight-year tax life, and RTN uses straight-line depreciation. At the end of the project, the plant and equipment can be scrapped for $3.7 million 5. The project requires $1,100,000 in initial networking capital investment to get operational 6. The plan is to manufacture 13,000 RDSs in the first year and sell them at $10,400 per machine. The following 4 years, the number to be produced grows by 15%, 20%, 25%. and 25% annually, i.e. year over year. We will continue to sell them at $10,400 each year 7. The company will incur $6,000,000 in annual fixed costs, and the variable production costs are $9.000 per RDS in the first year. The following 4 years, variable production costs will grow at a rate of 5%, 3%, 2%, and 2% annually, i.e. year over year 8. RTN's tax rate is 20 percent. 9. The following market data on RTN's securities is current: Debt: 222,000.7.2 percent coupon bonds are outstanding. 25 years to maturity, selling for 97.586 percent of par; the bonds have a $1,000 par value each and make semiannual payments. Common: 8,000,000 shares outstanding, selling for $150 per share; you have stock prices and S&P 500 index value for the past five years. Preferred: 442,000 shares of 5 percent preferred stock outstanding, selling for $104.63 per share and having a par value of $100. Market: 8 percent expected market risk premium; 3 percent risk-free rate. You will need to estimate RTN's beta using the data in the data file. To do so, you need to convert the prices to returns and then use the Excel slope command Date RIN S&P 72/2014 null mul 811/2014 86.67 2003.4 S11/2014 9142 13722 10/1/2014 94014 2018.1 11/1/2014 96.566 20676 1211/2014 97.896 2058.9 1/2015 90548 1995 2142015 98.991 21045 3/1/2015 99.428 20679 4/1/2015 95.23 2085,5 5/1/2015 94.552 2107.4 671/2015 87 612 20631 711/2015 100.58 2103.8 8/1/2015 96.91 19722 9/1/2015 100.74 1920 10/1/2015 108.24 20794 11/1/2015 115.07 2080.4 12/11/2015 115.53 20439 12016 118.98 1940:2 271 2016 115.52 1932.2 3/2016 114.39 2059,7 4712016 117.86 20553 6P12016 12168 20969 6/1/2016 127.57 2038.3 771/2016 130.93 2173.6 8742016 1322 2170.9 921/2015 128.43 2168.3 10/12016 128.68 212521 11/1/2018 44185 21988 12112016 138.77 2238.8 11/2017 137.45 22789 211/2017 146.97 23636 3/11/2017 145.4 23627 4712017 147.98 23842 5/2017 157.19 24118 6142017 154.77 24234 7192017 165.45 2470.3 BIM2017 175.32 2471 792017 179.72 2519.4 10/2017 173.57 25753 11/2017 184.91 2584 1211/2017 181.71 26736 1/1/2018 202.11 2823.8 2/1/2018 2113 2713,8 3/1/2018 209.66 2640.9 01/2018 199.09 26481 571/2018 204,34 27053 8/1/2018 188.42 27184 7712018 193.15 26163 81.2018 195.38 2015 01/2018 202.46 2914 10/1/2018 171.48 2717 11/1/2018 172.5 2760.2 12/1/2018 150.86 25069 412019 163,02 2704.1 2/1/2018 184,52 2784.5 371/2019 180.15 2834.4 4:1/2018 175.71 2945.8 51/2013 173.55 27521 67172019 172.94 29418 7/1/2019 1913 2380-4
Step by Step Solution
There are 3 Steps involved in it

Get step-by-step solutions from verified subject matter experts