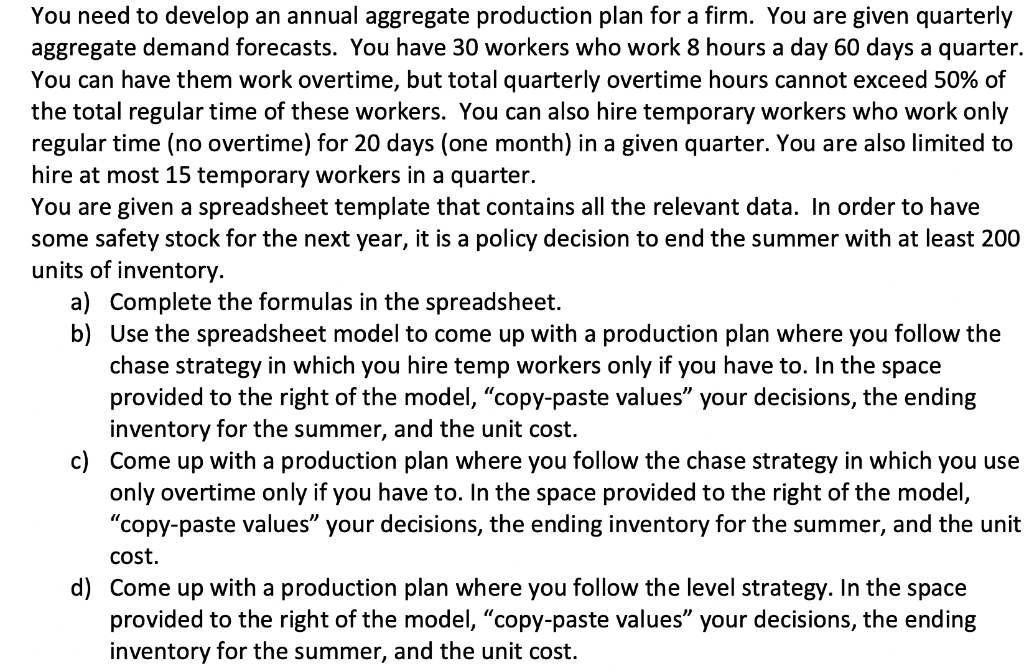
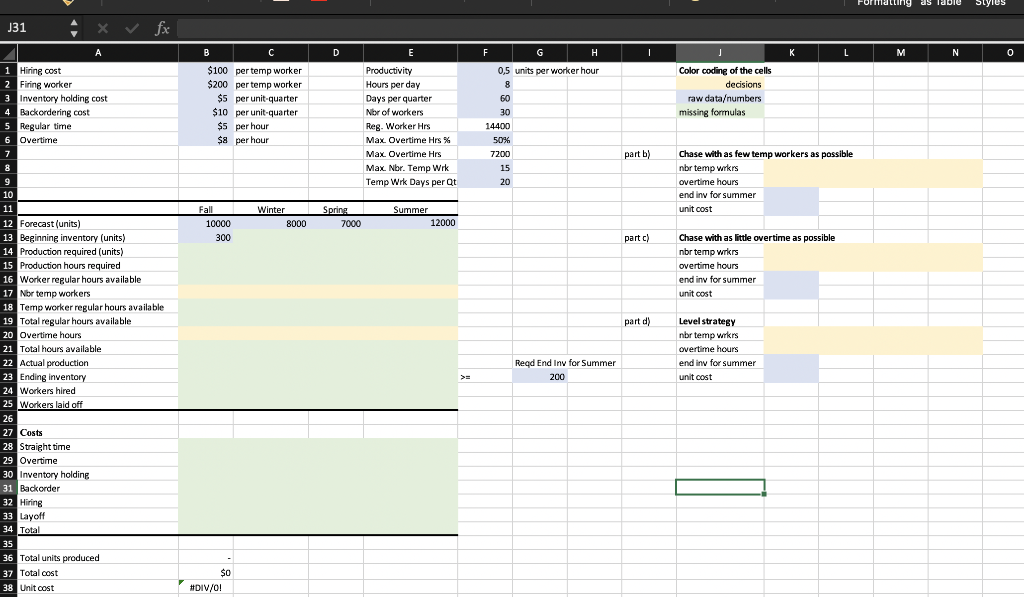
Question: You need to develop an annual aggregate production plan for a firm. You are given quarterly aggregate demand forecasts. You have 30 workers who work

You need to develop an annual aggregateYou need to develop an annual aggregate

You need to develop an annual aggregate production plan for a firm. You are given quarterly aggregate demand forecasts. You have 30 workers who work 8 hours a day 60 days a quarter. You can have them work overtime, but total quarterly overtime hours cannot exceed 50% of the total regular time of these workers. You can also hire temporary workers who work only regular time (no overtime) for 20 days (one month) in a given quarter. You are also limited to hire at most 15 temporary workers in a quarter. You are given a spreadsheet template that contains all the relevant data. In order to have some safety stock for the next year, it is a policy decision to end the summer with at least 200 units of inventory. a) Complete the formulas in the spreadsheet. b) Use the spreadsheet model to come up with a production plan where you follow the chase strategy in which you hire temp workers only if you have to. In the space provided to the right of the model, copy-paste values your decisions, the ending inventory for the summer, and the unit cost. c) Come up with a pro on plan where you follow the chase strategy in which you use only overtime only if you have to. In the space provided to the right of the model, "copy-paste values your decisions, the ending inventory for the summer, and the unit cost. d) Come up with a production plan where you follow the level strategy. In the space provided to the right of the model, copy-paste values your decisions, the ending inventory for the summer, and the unit cost. Formatting as labie Styles J31 - fx A B D E E | L N 0 1 Hiring cost 2 Firing worker 3 Inventory holding cost Backordering cost 5 Regular time 6 Overtime 7 $100 per temp worker $200 per temp worker $5 per unit-quarter $10 per unit-quarter $5 per hour $8 per hour F G H 0,5 units per worker hour 8 60 30 14400 50% 7200 15 Productivity Hours per day Days per quarter Nbr of workers Reg. Worker Hrs Max. Overtime Hrs % Max. Overtime Hrs Max. Nbr. Temp Wrk Temp Wrk Days per Qt Color coding of the cells decisions raw dataumbers missing formulas part b) 8 20 Chase with as few temp workers as possible nbr temp wrkrs overtime hours end inv for summer unit cost Fall 10000 300 Winter 8000 Spring 7000 Summer 12000 part) Chase with as little overtime as possible nbr temp wrkrs overtime hours end inv for summer unit cost part d) Level strategy nbr temp wirkers overtime hours end in for summer unit cost Read End Inv for Summer 200 9 10 11 12 Forecast (units) 13 Beginning inventory (units) 14 Production required (units) 15 Production hours required 16 Worker regular hours available 17 Nbr temp workers 18 Temp worker regular hours available 19 Total regular hours available 20 Overtime hours 21 Total hours available 22 Actual production 23 Ending inventory 24 Workers hired 25 Workers laid off 26 27 Costs 28 Straight time 29 Overtime 30 Inventory holding 31 Backorder 32 Hiring 33 Layoff 34 Total 35 36 Total units produced 37 Total cost 38 Unit oost $0 #DIV/01

Step by Step Solution

There are 3 Steps involved in it

1 Expert Approved Answer
Step: 1 Unlock blur-text-image
Question Has Been Solved by an Expert!

Get step-by-step solutions from verified subject matter experts

Step: 2 Unlock
Step: 3 Unlock

Students Have Also Explored These Related General Management Questions!