

Question: You need to perform two group comparison for the data shown in the diagram. Drag and drop the correct answers into the boxes provided on
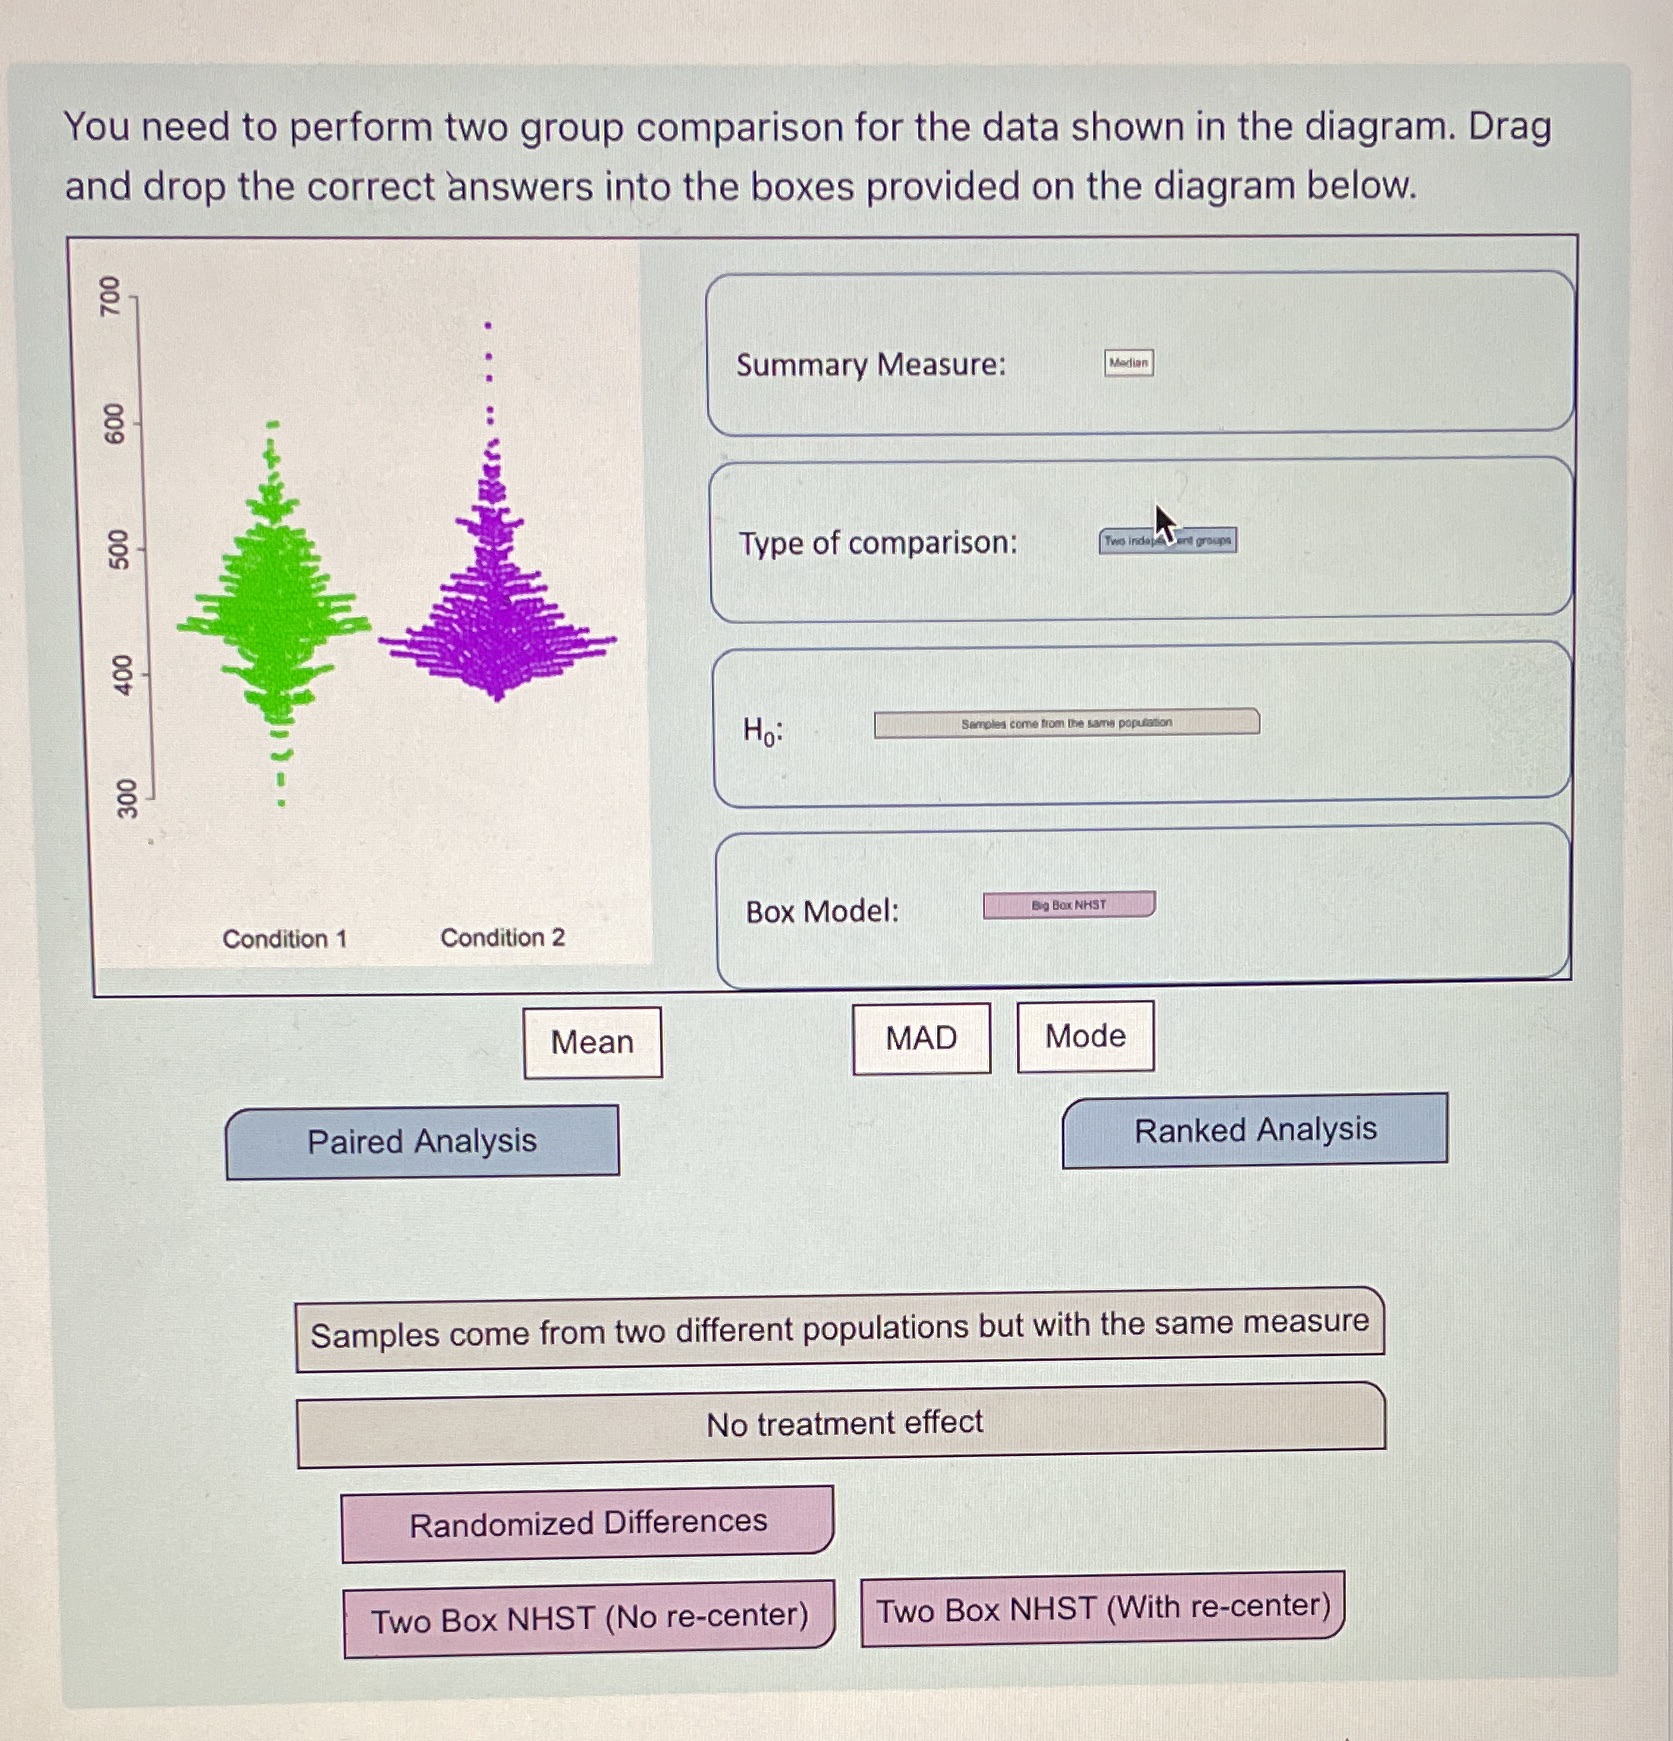
You need to perform two group comparison for the data shown in the diagram. Drag and drop the correct answers into the boxes provided on the diagram below. 700 Summary Measure: 600 500 Type of comparison: 400 Ho: Samples come from the was population 300 Box Model: Big Box NHST Condition 1 Condition 2 Mean MAD Mode Paired Analysis Ranked Analysis Samples come from two different populations but with the same measure No treatment effect Randomized Differences Two Box NHST (No re-center) Two Box NHST (With re-center)
Step by Step Solution
There are 3 Steps involved in it
1 Expert Approved Answer
Step: 1 Unlock

Question Has Been Solved by an Expert!
Get step-by-step solutions from verified subject matter experts
Step: 2 Unlock
Step: 3 Unlock