

Question: You run a regression for a stock's return on a market index and find the following Excel output: Multiple R R-Square Adjusted R-Square Standard Error
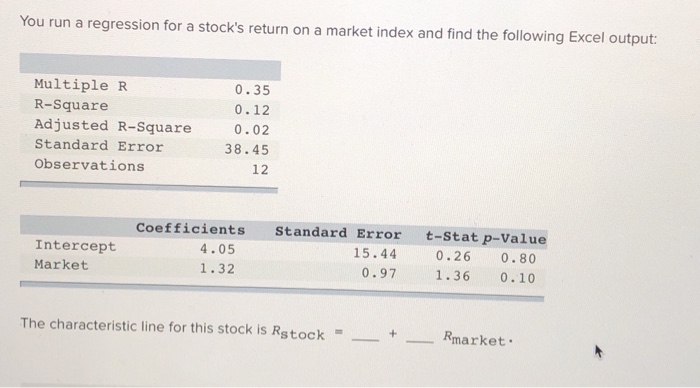

You run a regression for a stock's return on a market index and find the following Excel output: Multiple R R-Square Adjusted R-Square Standard Error Observations 0.35 0.12 0.02 38.45 Intercept Market Coefficients 4.05 1.32 Standard Error 15.44 0.97 t-Stat p-Value 0.26 0.80 1.36 0.10 The characteristic line for this stock is Rstock - Rmarket Multiple Choice 35; 12 4.05; 1.32 15.44; 97 .26; 1.36
Step by Step Solution
There are 3 Steps involved in it
1 Expert Approved Answer
Step: 1 Unlock

Question Has Been Solved by an Expert!
Get step-by-step solutions from verified subject matter experts
Step: 2 Unlock
Step: 3 Unlock