

Question: You should focus your calculations and analysis on the below ratios: Profitability ratios: 1. Return on Equity 2. Return on Equity (DuPont) 3. Return on
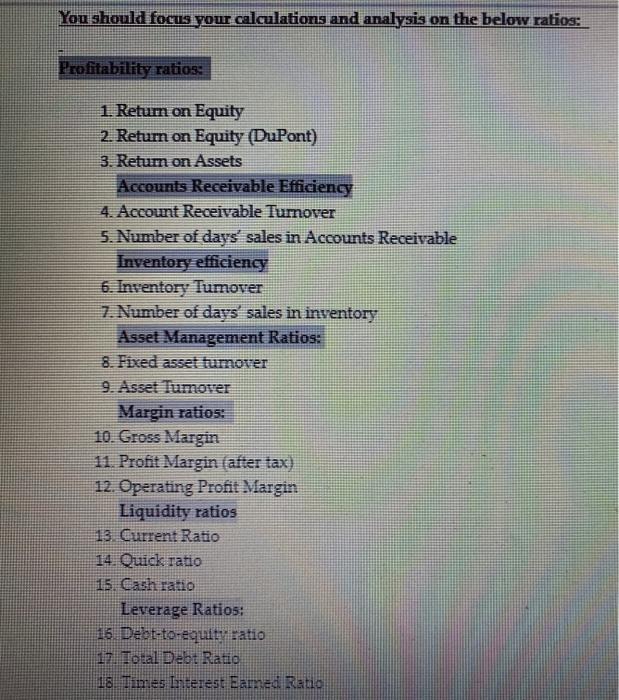
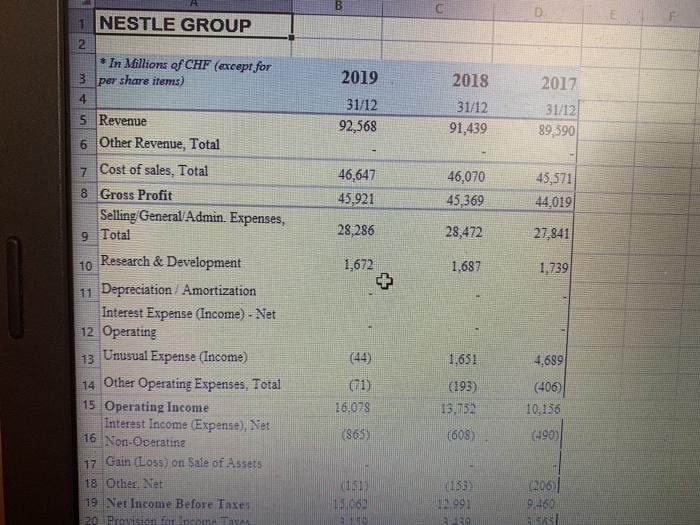
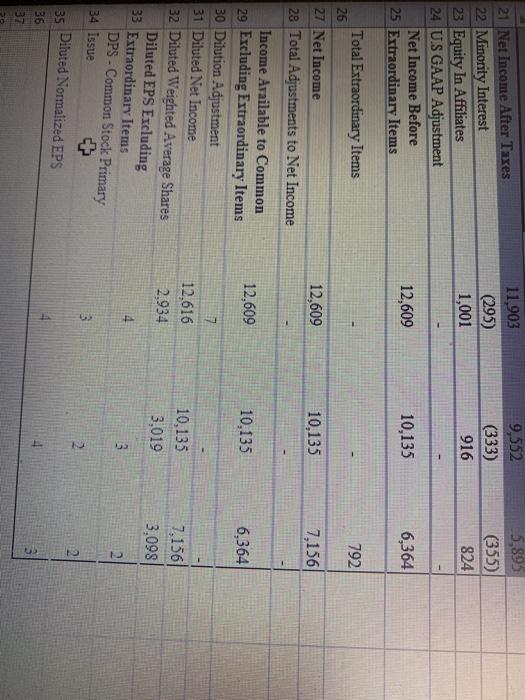
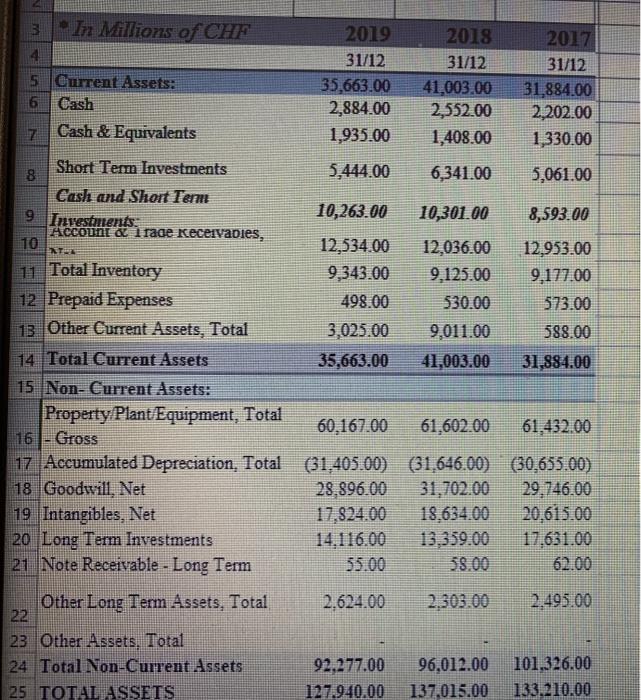
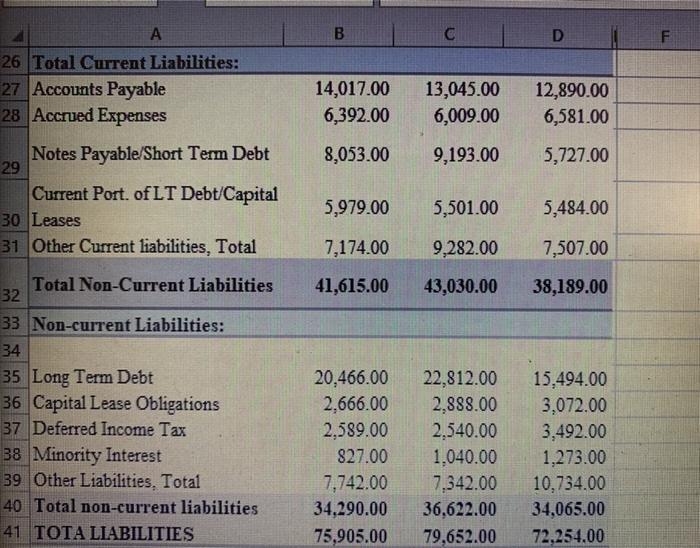
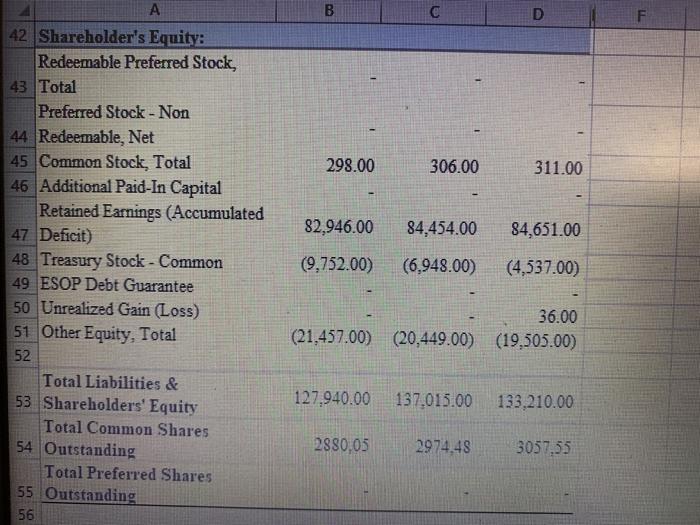
You should focus your calculations and analysis on the below ratios: Profitability ratios: 1. Return on Equity 2. Return on Equity (DuPont) 3. Return on Assets Accounts Receivable Efficiency 4. Account Receivable Turnover 5. Number of days' sales in Accounts Receivable Inventory efficiency 6. Inventory Tumorer 7. Number of days' sales in inventory Asset Management Ratios: 8. Fixed asset tumover 9. Asset lumover Margin ratios: 10. Gross Margin 11. Profit Margin after tax) 12. Operating Profit Margin Liquidity ratios 13 Current Ratio 14. Quick ratio 15. Cash ratio Leverage Ratios: 16. Debt-to-equity ratio 17. Total Debt Ratio 18. Times Interest Earned Ratio B D 2018 1 NESTLE GROUP 2 In Millions of CHF (except for 3 per share items) 4 5 Revenue 6 Other Revenue, Total 7 Cost of sales, Total 8 Gross Profit Selling General Admin Expenses, 2019 31/12 92,568 31/12 91,439 2017 31/12 89,590 46,647 45,921 46,070 45,369 45,571 44,019 9 Total 28,286 28,472 27,841 1,672 1,687 1,739 1,651 4,689 10 Research & Development 11 Depreciation / Amortization interest Expense (Income) - Net 12 Operating 13 Unusual Expense (Income) 14 Other Operating Expenses. Total 15 Operating Income Interest Income (Expense), Net 16 Non-Operating 17 Gain (Loss) on Sale of Assets 18 Other Net 19 Net Income Before Taxes 20 Provision for Income Tayar (11) 16,078 (193) 13:52 (406) 10.156 (365) (608) (490) 2001 9460 08 11,903 (295) 1,001 9,552 (333) 916 5,893 (355) 824 21 Net Income After Taxes 22 Minority Interest 23 Equity In Affiliates 24 US GAAP Adjustment Net Income Before 25 Extraordinary Items 12,609 10,135 6,364 792 12,609 10,135 7,156 12,609 10,135 6,364 Total Extraordinary Items 26 27 Net Income 28 Total Adjustments to Net Income Income Available to Common 29 Excluding Extraordinary Items 30 Dilution Adjustment 31 Diluted Net Income 32 Diluted Weighted Average Shares Diluted EPS Excluding 33 Extraordinary Items DPS - Common Stock Primary 34 Issue 35 Diluted Normalized EPS 36 37 7 12,616 2,934 10,135 3,019 7.156 3,098 3 cr 2 3 N 2 U 3 In Millions of CHF 2019 2018 2017 31/12 31/12 31/12 5 Ourrent Assets: 35,663.00 41,003.00 31,884.00 6 Cash 2,884.00 2,552.00 2,202.00 7 Cash & Equivalents 1,935.00 1,408.00 1330.00 Short Term Investments 8 5,444.00 6,341.00 5,061.00 Cash and Short Term 9 Investments: 10,263.00 10,301.00 8,593.00 Account & Trade Keceivables, TO 12,534.00 12,036.00 12,953.00 11 Total Inventory 9,343.00 9.125.00 9.177.00 12 Prepaid Expenses 498.00 530.00 573.00 13. Other Current Assets, Total 3,025.00 9,011.00 588.00 14 Total Current Assets 35,663.00 41,003.00 31,884.00 15 Non- Current Assets: Property Plant/Equipment, Total 60.167.00 61,602.00 61,432.00 16 - Gross 17 umulated Depreciation, Total (31.405.00) (31.646.00) 30,655.00) 18 Goodwill, Net 28.596.00 31,702.00 29.746.00 19 Intangibles, Net 17.824.00 18.634.00 20.615.00 20 Long Term Investments 14,116,00 13.352.00 17.631.00 21 Note Receivable - Long Term 55.00 58.00 62.00 Other Long Term Assets, Total 2.624.00 2.303.00 2.495.00 22 23 Other Assets, Total 24 Total Non-Current Assets 25 TOTAL ASSETS 92.277.00 127.940.00 96,012.00 137,015.00 101.326.00 133.210.00 B C D F A 26 Total Current Liabilities: 27 Accounts Payable 28 Accrued Expenses 14,017.00 6,392.00 13,045.00 6,009.00 12,890.00 6,581.00 8,053.00 9,193.00 5,727.00 Notes Payable/Short Term Debt 29 Current Port of LT Debt/Capital 30 Leases 31 Other Current liabilities, Total 5,979.00 5,501.00 5,484.00 7,174.00 9,282.00 7,507.00 41,615.00 43,030.00 38,189.00 Total Non-Current Liabilities 32 33 Non-current Liabilities: 34 35 Long Term Debt 36 Capital Lease Obligations 37 Deferred Income Tax 38 Minority Interest 39 Other Liabilities, Total 40 Total non-current liabilities 41 TOTA LIABILITIES 20,466.00 2.666.00 2,589.00 827.00 7,742.00 34,290.00 75,905.00 22,812.00 2.888.00 2,540.00 1.040.00 7,342.00 36,622.00 79,652.00 15,494.00 3,072.00 3,492.00 1,273.00 10,734.00 34,065.00 72,254.00 B D 298.00 306.00 311.00 82,946.00 84,454.00 84,651.00 42 Shareholder's Equity: Redeemable Preferred Stock, 43 Total Preferred Stock - Non 44 Redeemable, Net 45 Common Stock, Total 46 Additional Paid-In Capital Retained Earnings (Accumulated 47 Deficit) 48 Treasury Stock - Common 49 ESOP Debt Guarantee 50 Unrealized Gain (Loss) 51 Other Equity, Total 52 Total Liabilities & 53 Shareholders' Equity Total Common Shares 54 Outstanding Total Preferred Shares 55 Outstanding 56 (9,752.00) (6,948.00) (4,537.00) 36.00 (21,457.00) (20,449.00) (19,505.00) 127.940.00 137,015.00 133,210.00 2880,05 2974.48 3057.55 5
Step by Step Solution
There are 3 Steps involved in it

Get step-by-step solutions from verified subject matter experts