Question: You should have found that the values produced by the five methods are relatively consistent, but there are differences. 22 23 24 INPUT DATA: KEY
You should have found that the values produced by the five methods are relatively consistent, but there are differences.
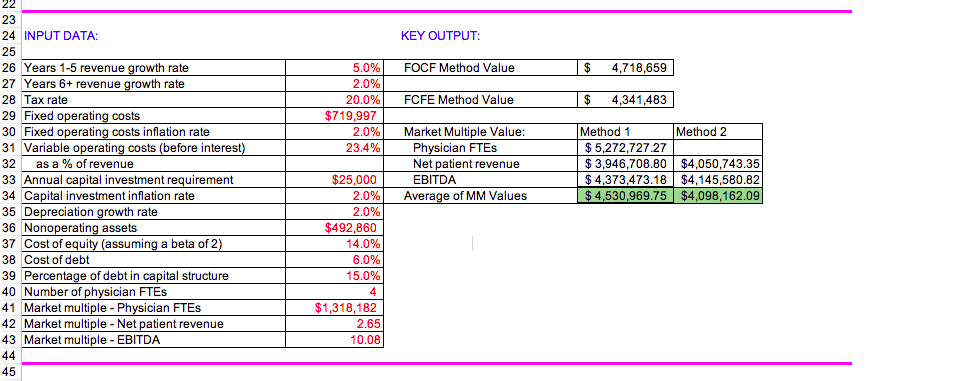
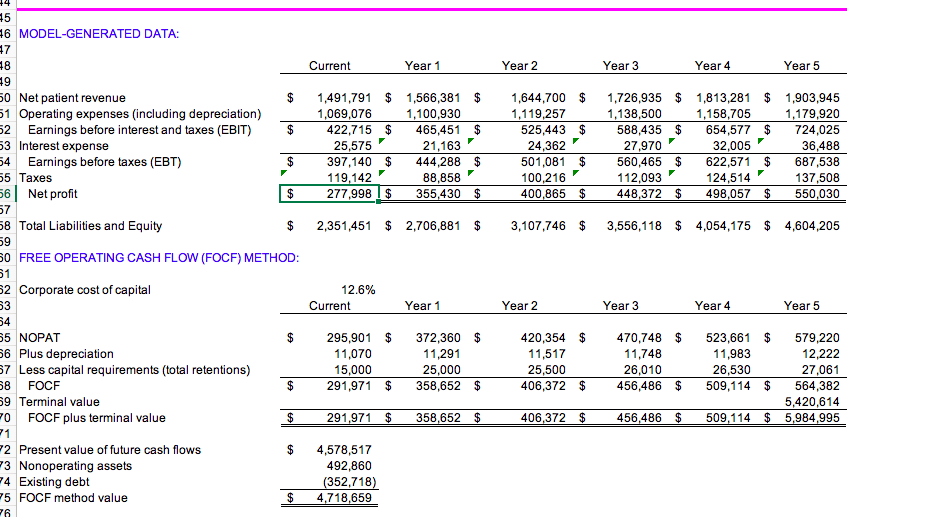
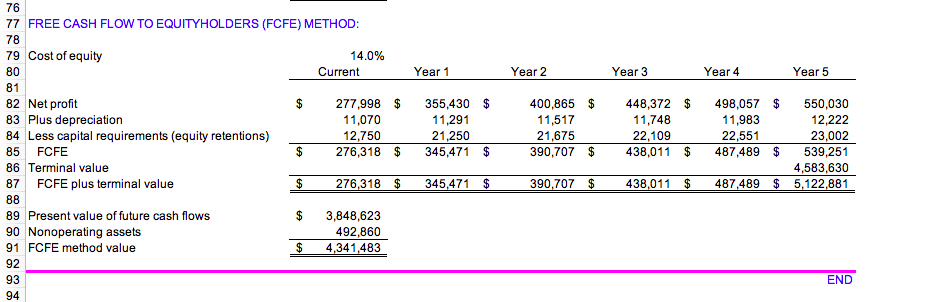
22 23 24 INPUT DATA: KEY OUTPUT: 25 26 Years 1-5 revenue growth rate 5.0% FOCF Method Value $ 4,718,659 27 Years 6+ revenue growth rate 2.0% 28 Tax rate 20.0% FCFE Method Value $ 4,341,483 29 Fixed operating costs $719,997 30 Fixed operating costs inflation rate 2.0% Market Multiple Value: Method 1 Method 2 31 Variable operating costs (before interest) 23.4% Physician FTEs $ 5,272,727.27 32 as a % of revenue Net patient revenue $ 3,946,708.80 $4,050,743.35 33 Annual capital investment requirement $25,000 EBITDA $ 4,373,473.18 $4,145,580.82 34 Capital investment inflation rate 2.0% Average of MM Values $ 4,530,969.75 $4,098, 162.09 35 Depreciation growth rate 2.0% 36 Nonoperating assets $492,860 37 Cost of equity (assuming a beta of 2) 14.0% 38 Cost of debt 6.0% 39 Percentage of debt in capital structure 15.0% 40 Number of physician FTEs 4 41 Market multiple - Physician FTEs $1,318,182 42 Market multiple - Net patient revenue 2.65 43 Market multiple - EBITDA 10.08 44 4516 MODEL-GENERATED DATA: 7 8 Current Year 1 Year 2 Year 3 Year 4 Year 5 9 0 Net patient revenue $ 1,491,791 $ 1,566,381 $ 1,644,700 $ 1,726,935 $ 1,813,281 $ 1,903,945 1 Operating expenses (including depreciation) 1,069,076 1,100,930 1,1 19,257 1,138,500 1,158,705 1,179,920 2 Earnings before interest and taxes (EBIT) $ 422,715 $ 465,451 $ 525,443 $ 588,435 $ 654,577 $ 724,025 Interest expense 25,575 21,163 24,362 27,970 32,005 36,488 4 Earnings before taxes (EBT) $ 397,140 $ 444,288 $ 501,081 $ 560,465 $ 622,571 $ 687,538 15 Taxes 119,142 88,858 100,216 112,093 124,514 137,508 6 Net profit $ 277,998 | $ 355,430 $ 400,865 $ 448,372 $ 498,057 $ 550,030 7 8 Total Liabilities and Equity $ 2,351,451 $ 2,706,881 $ 3,107,746 $ 3,556,118 $ 4,054,175 $ 4,604,205 0 FREE OPERATING CASH FLOW (FOCF) METHOD: i2 Corporate cost of capital 12.6% Current Year 1 Year 2 Year 3 Year 4 Year 5 14 5 NOPAT $ 295,901 $ 372,360 $ 420,3549 470,748 $ 523,661 $ 579,220 56 Plus depreciation 11,070 11,291 11,517 11,748 11,983 12,222 7 Less capital requirements (total retentions) 15,000 25,000 25,500 26,010 26,530 27,061 8 FOCF $ 291,971 $ 358,652 $ 406,372 $ 456,486 $ 509,114 $ 564,382 Terminal value 5,420,614 0 FOCF plus terminal value $ 291,971 $ 358,652 $ 406,372 $ 456,486 $ 509,114 $ 5,984,995 Present value of future cash flows $ IN 4,578,517 3 Nonoperating assets 492,860 Existing debt (352,718) 5 FOCF method value $ 4,718,65976 77 FREE CASH FLOW TO EQUITYHOLDERS (FCFE) METHOD: 78 79 Cost of equity 14.0% 80 Current Year 1 Year 2 Year 3 Year 4 Year 5 81 82 Net profit 277,998 $ 355,430 $ 400,865 $ 448,372 $ 498,057 $ 550,030 83 Plus depreciation 11,070 11,291 11,517 11,748 11,983 12,222 84 Less capital requirements (equity retentions) 12,750 21,250 21,675 22,109 22,551 23,002 85 FCFE $ 276,318 $ 345,471 $ 390,707 438,011 $ 487,489 $ 539,251 86 Terminal value 4,583,630 87 FCFE plus terminal value $ 276,318 345,471 $ 390,707 $ 438,011 $ 487,489 $ 5,122,881 88 89 Present value of future cash flows $ 3,848,623 90 Nonoperating assets 492,860 91 FCFE method value $ 4,341,483 92 93 END 94
Step by Step Solution
There are 3 Steps involved in it
1 Expert Approved Answer
Step: 1 Unlock
Question Has Been Solved by an Expert!
Get step-by-step solutions from verified subject matter experts
Step: 2 Unlock
Step: 3 Unlock
Students Have Also Explored These Related Finance Questions!