

Question: You should identify dimensions, map dimensions to data sources, and specify dimension hierarchies. For each dimension, you should identify its data sources and attributes in

- You should identify dimensions, map dimensions to data sources, and specify dimension hierarchies. For each dimension, you should identify its data sources and attributes in each data source. For hierarchical dimensions, you should indicate the levels from broad to narrow.
- You should specify measures, related data sources, and measure aggregation properties.
- Identify the grain in your dimensional design using the business needs as a guideline. You should then indicate relative storage requirements for the grain using the statistics for the data sources. Using the cardinality estimates provided, you should determine either the fact table size or sparsity and then compute the unknown grain size variable. For example, you should compute sparsity if the fact table size is given.
- Extend your analysis to design a star schema (or variation) to support inventory analysis. For each table, you should define the table name, primary key, and columns. You do not need to write complete CREATE TABLE statements.
- Identify summarizability potential problems in your star schema and indicate preferred resolutions of the summarizability problems. For incomplete dimension-fact relationships, you should also indicate if columns in a dimension table allow null values.
- You should populate your data warehouse tables based on the data in the sample tables and spreadsheet. You do not need to write SQL INSERT statements or insert data into database tables. You can just show table listings in your solution. You should indicate mappings from data sources into tables. For example, a mapping may involve generating new primary key values for a data warehouse table or using a default value for a missing value.
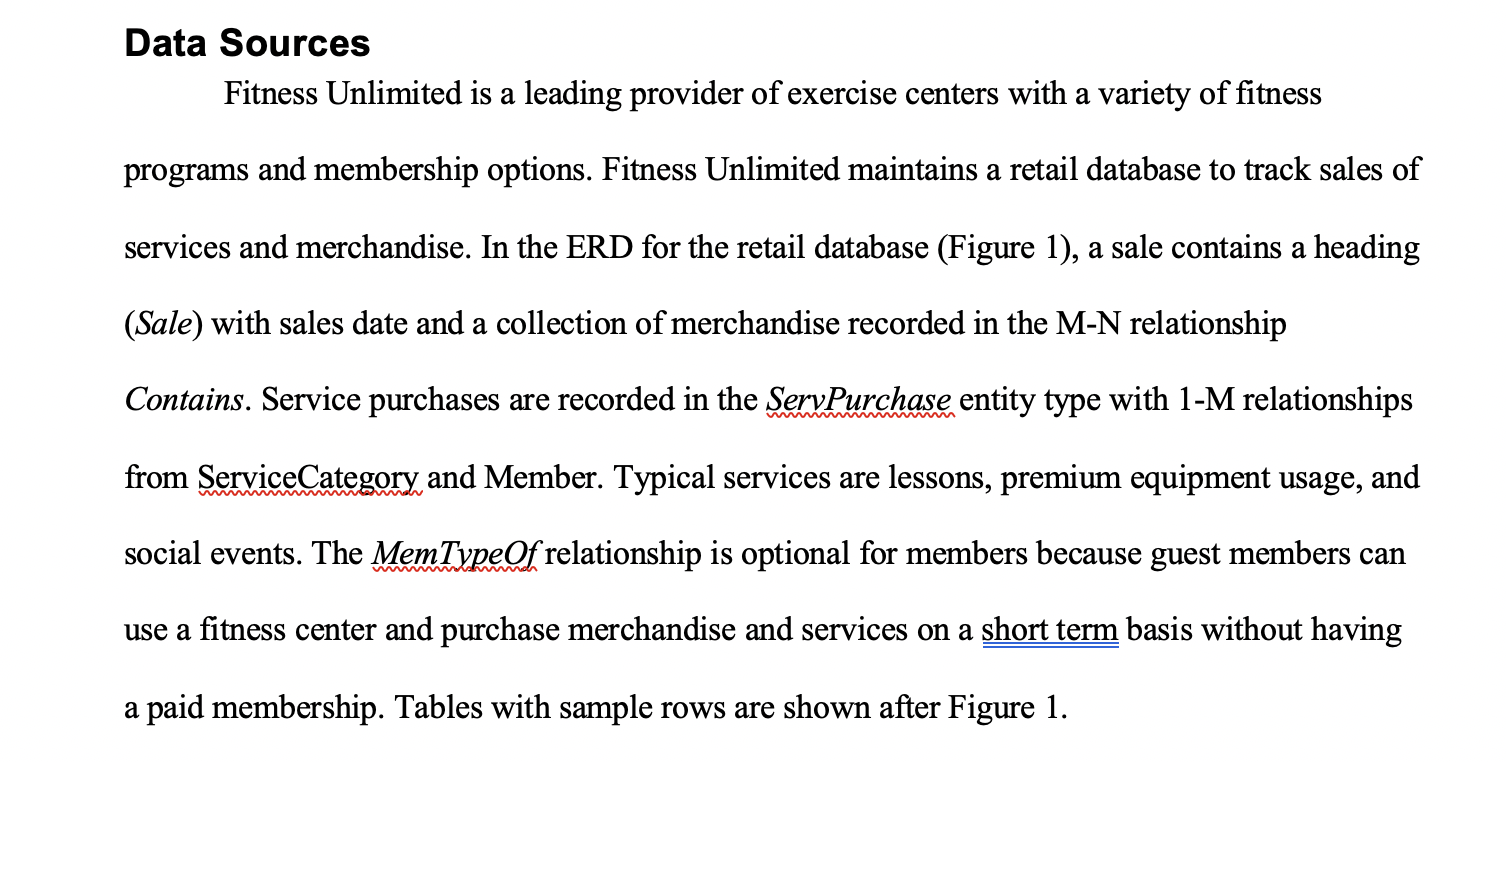
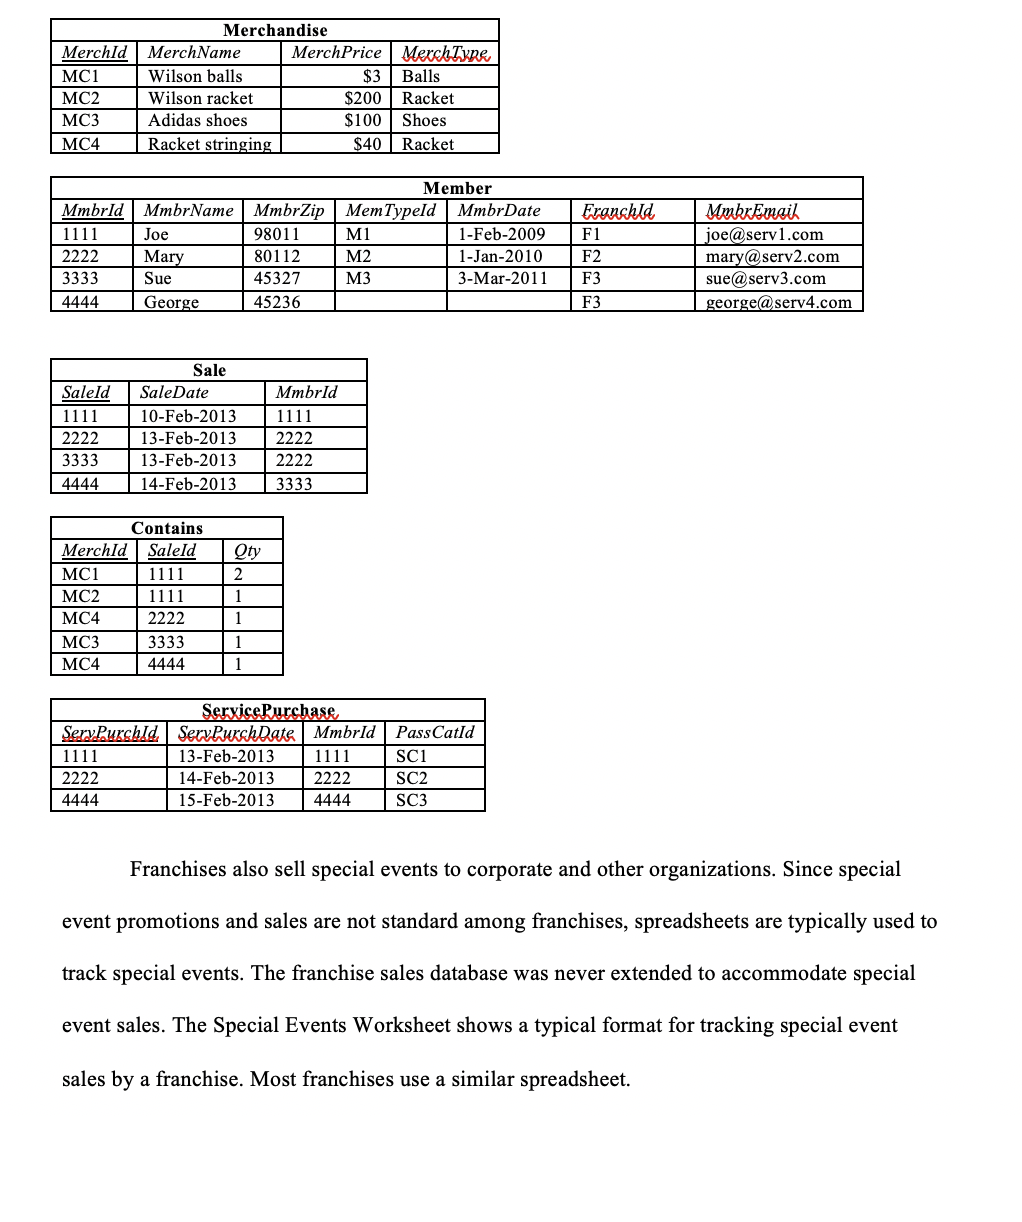
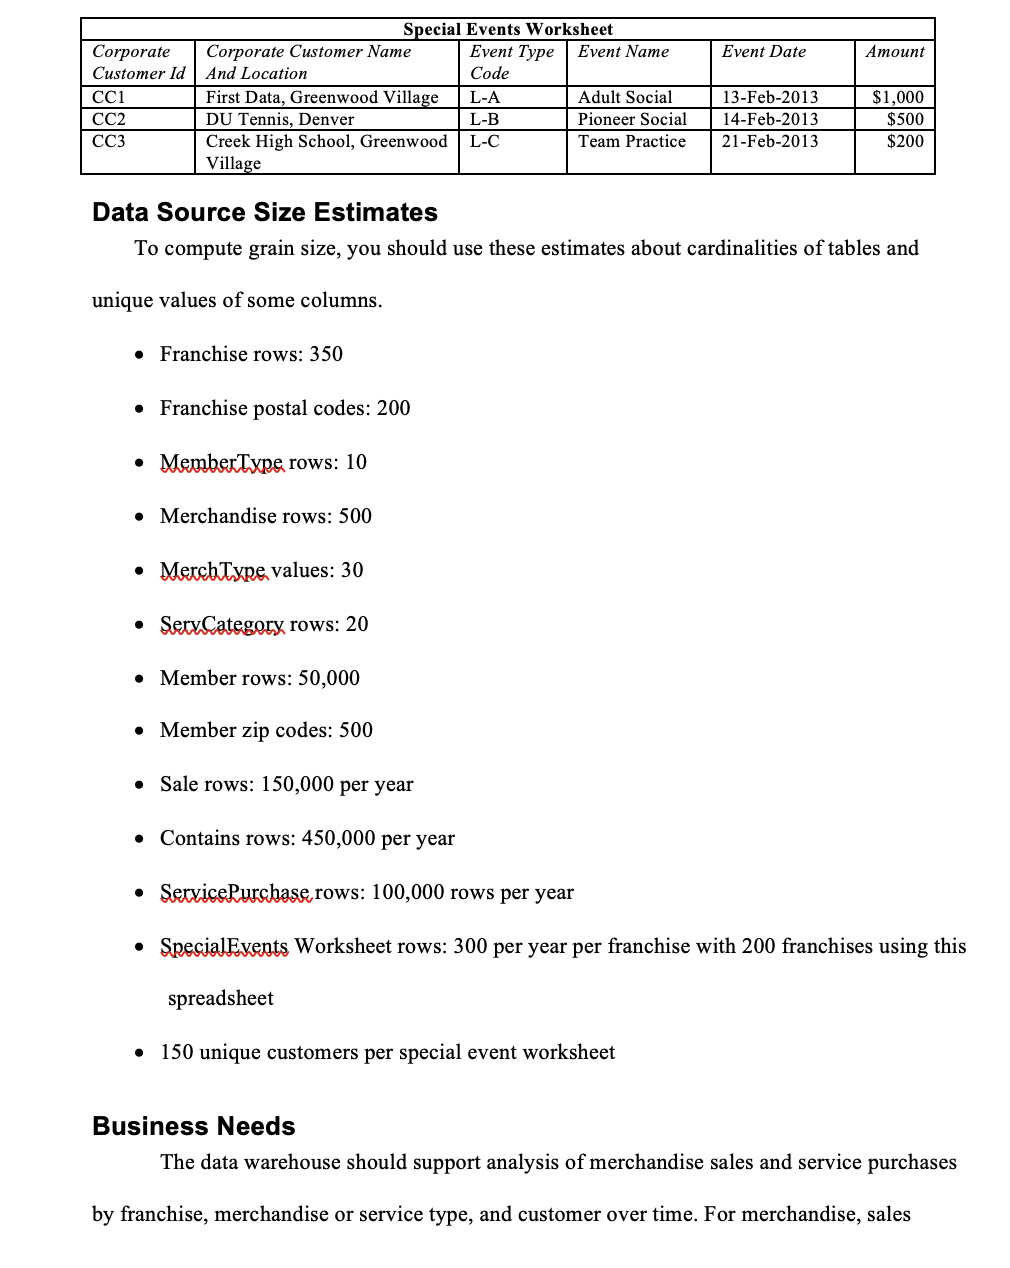
Data Sources Fitness Unlimited is a leading provider of exercise centers with a variety of fitness programs and membership options. Fitness Unlimited maintains a retail database to track sales of services and merchandise. In the ERD for the retail database (Figure 1), a sale contains a heading (Sale) with sales date and a collection of merchandise recorded in the M-N relationship Contains. Service purchases are recorded in the ServPurchase entity type with 1-M relationships from ServiceCategory and Member. Typical services are lessons, premium equipment usage, and social events. The MemTypeOf relationship is optional for members because guest members can use a fitness center and purchase merchandise and services on a short term basis without having a paid membership. Tables with sample rows are shown after Figure 1. MerchId MC1 MC2 MC3 MC4 Merchandise MerchName MerchPrice MerchType Wilson balls $3 Balls Wilson racket $200 Racket Adidas shoes $100 Shoes Racket stringing $40 Racket Mmbrld 1111 2222 3333 4444 Member MmbrName MmbrZip Mem Typeld MmbrDate Joe 98011 M1 1-Feb-2009 Mary 80112 M2 1-Jan-2010 Sue 45327 M3 3-Mar-2011 45236 Franchid F1 F2 F3 MmbrEmail joe@serv1.com mary@serv2.com sue@serv3.com george@serv4.com George F3 Saleld 1111 2222 3333 4444 Sale SaleDate 10-Feb-2013 13-Feb-2013 13-Feb-2013 14-Feb-2013 Mmbrld 1111 2222 2222 3333 Contains Merchld Saleld MC1 1111 MC2 1111 MC4 2222 MC3 3333 MC4 4444 Qty 2 1 1 1 1 Service Purchase Sery Purchld ServPurch Data Mmbrld 13-Feb-2013 1111 2222 14-Feb-2013 2222 4444 15-Feb-2013 4444 1111 Pass Catld SC1 SC2 SC3 Franchises also sell special events to corporate and other organizations. Since special event promotions and sales are not standard among franchises, spreadsheets are typically used to track special events. The franchise sales database was never extended to accommodate special event sales. The Special Events Worksheet shows a typical format for tracking special event sales by a franchise. Most franchises use a similar spreadsheet. Event Date Amount Corporate Customer Id CC1 CC2 CC3 Special Events Worksheet Corporate Customer Name Event Type Event Name And Location Code First Data, Greenwood Village L-A Adult Social DU Tennis, Denver L-B Pioneer Social Creek High School, Greenwood L-C Team Practice Village 13-Feb-2013 14-Feb-2013 21-Feb-2013 $1,000 $500 $200 Data Source Size Estimates To compute grain size, you should use these estimates about cardinalities of tables and unique values of some columns. Franchise rows: 350 Franchise postal codes: 200 MemberType rows: 10 Merchandise rows: 500 MerchType, values: 30 SeryCategory rows: 20 Member rows: 50,000 Member zip codes: 500 Sale rows: 150,000 per year Contains rows: 450,000 per year Service Purchase rows: 100,000 rows per year SpecjalEvents Worksheet rows: 300 per year per franchise with 200 franchises using this spreadsheet 150 unique customers per special event worksheet Business Needs The data warehouse should support analysis of merchandise sales and service purchases by franchise, merchandise or service type, and customer over time. For merchandise, sales amount is computed as quantity times selling price. For services purchases, each unit sale is recorded separately so only the service price at the time of purchase is recorded. For customer, merchandise sales should be tracked by zip code, membership date, and member type. For franchise, merchandise sales should be tracked by franchise region, postal code, and model type. The corporate sales office wants a high level of flexibility for sales analysis. For data mining analysis, they need detail by individual customer, product or service, and franchise, and date. For typical reporting applications, they need detail by customer location, franchise location, and product or service type, and week. Problems You should design a star schema (or variation) to support revenue analysis. You should pay close attention to the grain of the fact table, the major part of the star schema diagram. As part of the design, you should identify all relevant dimensions with hierarchies specified. In your documentation, you should identify summarizability problems in your star schema and indicate mapping from data sources into tables. You should populate your data warehouse tables based on the data in the operational tables and spreadsheet. You do not need to insert the data into your tables. You can just show table listings in your solution document. Your sample rows should include all revenue events in the range February 10, 2013 to February 21, 2013. Data Sources Fitness Unlimited is a leading provider of exercise centers with a variety of fitness programs and membership options. Fitness Unlimited maintains a retail database to track sales of services and merchandise. In the ERD for the retail database (Figure 1), a sale contains a heading (Sale) with sales date and a collection of merchandise recorded in the M-N relationship Contains. Service purchases are recorded in the ServPurchase entity type with 1-M relationships from ServiceCategory and Member. Typical services are lessons, premium equipment usage, and social events. The MemTypeOf relationship is optional for members because guest members can use a fitness center and purchase merchandise and services on a short term basis without having a paid membership. Tables with sample rows are shown after Figure 1. MerchId MC1 MC2 MC3 MC4 Merchandise MerchName MerchPrice MerchType Wilson balls $3 Balls Wilson racket $200 Racket Adidas shoes $100 Shoes Racket stringing $40 Racket Mmbrld 1111 2222 3333 4444 Member MmbrName MmbrZip Mem Typeld MmbrDate Joe 98011 M1 1-Feb-2009 Mary 80112 M2 1-Jan-2010 Sue 45327 M3 3-Mar-2011 45236 Franchid F1 F2 F3 MmbrEmail joe@serv1.com mary@serv2.com sue@serv3.com george@serv4.com George F3 Saleld 1111 2222 3333 4444 Sale SaleDate 10-Feb-2013 13-Feb-2013 13-Feb-2013 14-Feb-2013 Mmbrld 1111 2222 2222 3333 Contains Merchld Saleld MC1 1111 MC2 1111 MC4 2222 MC3 3333 MC4 4444 Qty 2 1 1 1 1 Service Purchase Sery Purchld ServPurch Data Mmbrld 13-Feb-2013 1111 2222 14-Feb-2013 2222 4444 15-Feb-2013 4444 1111 Pass Catld SC1 SC2 SC3 Franchises also sell special events to corporate and other organizations. Since special event promotions and sales are not standard among franchises, spreadsheets are typically used to track special events. The franchise sales database was never extended to accommodate special event sales. The Special Events Worksheet shows a typical format for tracking special event sales by a franchise. Most franchises use a similar spreadsheet. Event Date Amount Corporate Customer Id CC1 CC2 CC3 Special Events Worksheet Corporate Customer Name Event Type Event Name And Location Code First Data, Greenwood Village L-A Adult Social DU Tennis, Denver L-B Pioneer Social Creek High School, Greenwood L-C Team Practice Village 13-Feb-2013 14-Feb-2013 21-Feb-2013 $1,000 $500 $200 Data Source Size Estimates To compute grain size, you should use these estimates about cardinalities of tables and unique values of some columns. Franchise rows: 350 Franchise postal codes: 200 MemberType rows: 10 Merchandise rows: 500 MerchType, values: 30 SeryCategory rows: 20 Member rows: 50,000 Member zip codes: 500 Sale rows: 150,000 per year Contains rows: 450,000 per year Service Purchase rows: 100,000 rows per year SpecjalEvents Worksheet rows: 300 per year per franchise with 200 franchises using this spreadsheet 150 unique customers per special event worksheet Business Needs The data warehouse should support analysis of merchandise sales and service purchases by franchise, merchandise or service type, and customer over time. For merchandise, sales amount is computed as quantity times selling price. For services purchases, each unit sale is recorded separately so only the service price at the time of purchase is recorded. For customer, merchandise sales should be tracked by zip code, membership date, and member type. For franchise, merchandise sales should be tracked by franchise region, postal code, and model type. The corporate sales office wants a high level of flexibility for sales analysis. For data mining analysis, they need detail by individual customer, product or service, and franchise, and date. For typical reporting applications, they need detail by customer location, franchise location, and product or service type, and week. Problems You should design a star schema (or variation) to support revenue analysis. You should pay close attention to the grain of the fact table, the major part of the star schema diagram. As part of the design, you should identify all relevant dimensions with hierarchies specified. In your documentation, you should identify summarizability problems in your star schema and indicate mapping from data sources into tables. You should populate your data warehouse tables based on the data in the operational tables and spreadsheet. You do not need to insert the data into your tables. You can just show table listings in your solution document. Your sample rows should include all revenue events in the range February 10, 2013 to February 21, 2013
Step by Step Solution
There are 3 Steps involved in it

Get step-by-step solutions from verified subject matter experts