

Question: You should use Excel to do your work for this project. Financial Statement Analysis Download the financial statements for your company here: Tesla. Download Download

 You should use Excel to do your work for this project. Financial Statement Analysis Download the financial statements for your company here: Tesla. Download Download the financial statements for your company here: Tesla. This Excel file contains 3 tabs with the Income Statements, Balance Sheets and Statement of Cash Flows for the last 5 full fiscal years (2017-2021) for your company. Project To Do List: Overall you will be calculating the ratios in Chapter 4 of the book except for Market Value ratios and analyzing the ratios as instructed below. Convert all the profitability ratios to percentages and round to two decimal places (0.00%) and all other ratios to 3 decimal places (0.123). Use Net Income to Company as Net Income and use a tax rate of 25% for any ratios or calculations requiring a tax rate. A paragraph or two of analysis for each item below will suffice. Your Company’s Trend Analysis. Calculate the liquidity ratios (2 ratios) for each of the last 5 years and access how your company’s liquidity position has changed over time. Calculate the asset management ratios (4 ratios) for each of the last 5 years and access how your company’s asset management position has changed over time. Calculate the debt management ratios (3 ratios including the liabilites to assets ratio) for each of the last 5 years and access how your company’s debt management position has changed over time. Calculate the profitability ratios for each of the last 35years and access how your company’s profitability position has changed over time. What is your company’s biggest strength and weakness based on this trend analysis. DuPont Analysis. Break down your company’s Return on Equity, ROE, into the 3-part DuPont Equation for each year. Comment on what factors caused changes in your company’s ROE over the time period. Free Cash Flow Calculation. Calculate your company’s Free Cash Flow for each of the last 4 fiscal years (2018-2021). Use a tax rate of 25% and use the depreciation and amortization from the Cash Flow statement. Please do not use any other data from the Cash Flow statement, calculate changes in the relevant balance sheet accounts from year to year (for example: total current assets, gross property plant & equipment, accounts payable & accrued expenses).
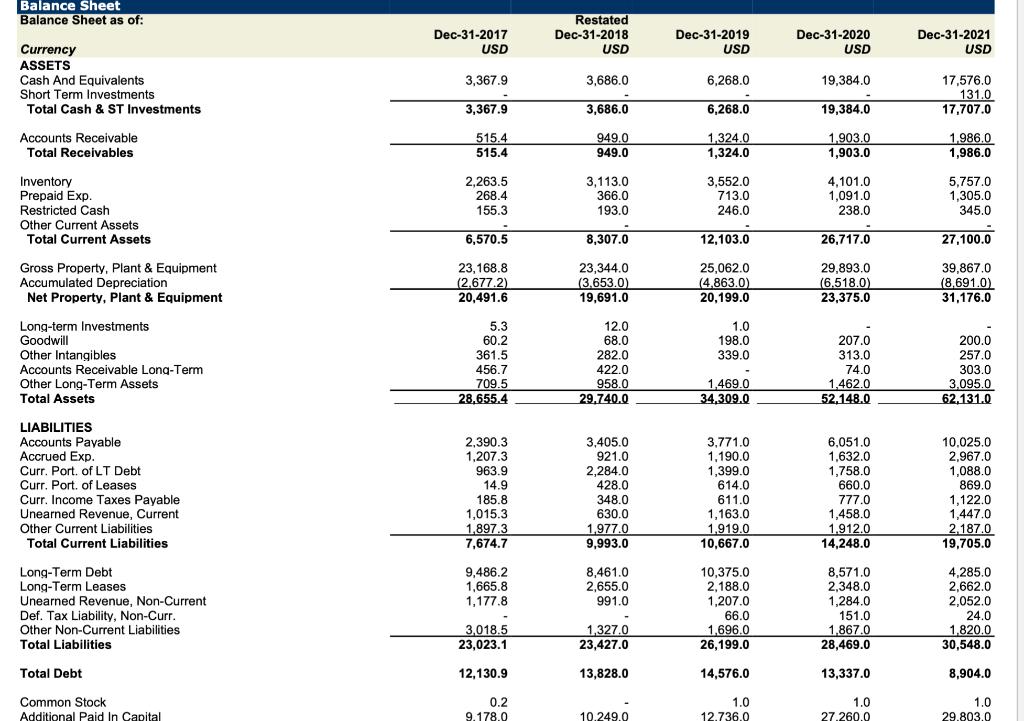
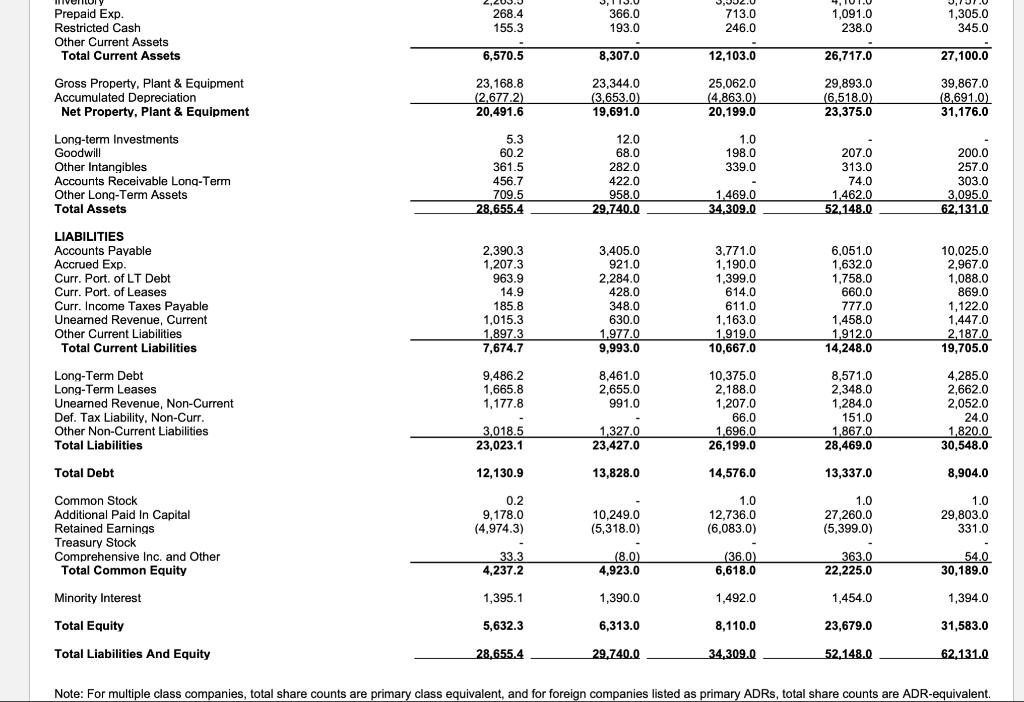
Balance Sheet Balance Sheet as of: Currency ASSETS Cash And Equivalents Short Term Investments Total Cash & ST Investments Accounts Receivable Total Receivables Inventory Prepaid Exp. Restricted Cash Other Current Assets Total Current Assets Gross Property, Plant & Equipment Accumulated Depreciation Net Property, Plant & Equipment Long-term Investments Goodwill Other Intangibles Accounts Receivable Long-Term Other Long-Term Assets Total Assets LIABILITIES Accounts Payable Accrued Exp. Curr. Port. of LT Debt Curr. Port. of Leases Curr. Income Taxes Payable Unearned Revenue, Current Other Current Liabilities Total Current Liabilities Long-Term Debt Long-Term Leases Unearned Revenue, Non-Current Def. Tax Liability, Non-Curr. Other Non-Current Liabilities Total Liabilities Total Debt Common Stock Additional Paid In Capital Dec-31-2017 USD 3,367.9 3,367.9 515.4 515.4 2,263.5 268.4 155.3 6,570.5 23,168.8 (2.677.2) 20,491.6 5.3 60.2 361.5 456.7 709.5 28,655.4 2,390.3 1,207.3 963.9 14.9 185.8 1,015.3 1,897.3 7,674.7 9,486.2 1,665.8 1,177.8 3,018.5 23,023.1 12.130.9 0.2 9.178.0 Restated Dec-31-2018 USD 3,686.0 3,686.0 949.0 949.0 3,113.0 366.0 193.0 8,307.0 23,344.0 (3.653.0) 19,691.0 12.0 68.0 282.0 422.0 958.0 29,740.0 3,405.0 921.0 2,284.0 428.0 348.0 630.0 1,977.0 9,993.0 8,461.0 2,655.0 991.0 1,327.0 23,427.0 13,828.0 10.249.0 Dec-31-2019 USD 6,268.0 6,268.0 1,324.0 1,324.0 3,552.0 713.0 246.0 12,103.0 25,062.0 (4,863.0) 20,199.0 1.0 198.0 339.0 1,469.0 34,309.0 3,771.0 1,190.0 1,399.0 614.0 611.0 1,163.0 1,919.0 10,667.0 10,375.0 2,188.0 1,207.0 66.0 1,696.0 26,199.0 14,576.0 1.0 12.736.0 Dec-31-2020 USD 19,384.0 19,384.0 1,903.0 1,903.0 4,101.0 1,091.0 238.0 26,717.0 29,893.0 (6.518.0) 23,375.0 207.0 313.0 74.0 1,462.0 52,148.0 6,051.0 1,632.0 1,758.0 660.0 777.0 1,458.0 1.912.0 14,248.0 8,571.0 2,348.0 1,284.0 151.0 1,867.0 28,469.0 13,337.0 1.0 27.260.0 Dec-31-2021 USD 17,576.0 131.0 17,707.0 1,986.0 1,986.0 5,757.0 1,305.0 345.0 27,100.0 39,867.0 (8,691.0) 31,176.0 200.0 257.0 303.0 3.095.0 62,131.0 10,025.0 2,967.0 1,088.0 869.0 1,122.0 1,447.0 2,187.0 19,705.0 4,285.0 2,662.0 2,052.0 24.0 1,820.0 30,548.0 8,904.0 1.0 29.803.0
Step by Step Solution
3.53 Rating (156 Votes )
There are 3 Steps involved in it
In a video that plays in a splitscreen with your work area y... View full answer

Get step-by-step solutions from verified subject matter experts